Bahamian vs Belgian Male Disability
COMPARE
Bahamian
Belgian
Male Disability
Male Disability Comparison
Bahamians
Belgians
11.9%
MALE DISABILITY
1.1/ 100
METRIC RATING
241st/ 347
METRIC RANK
12.1%
MALE DISABILITY
0.3/ 100
METRIC RATING
259th/ 347
METRIC RANK
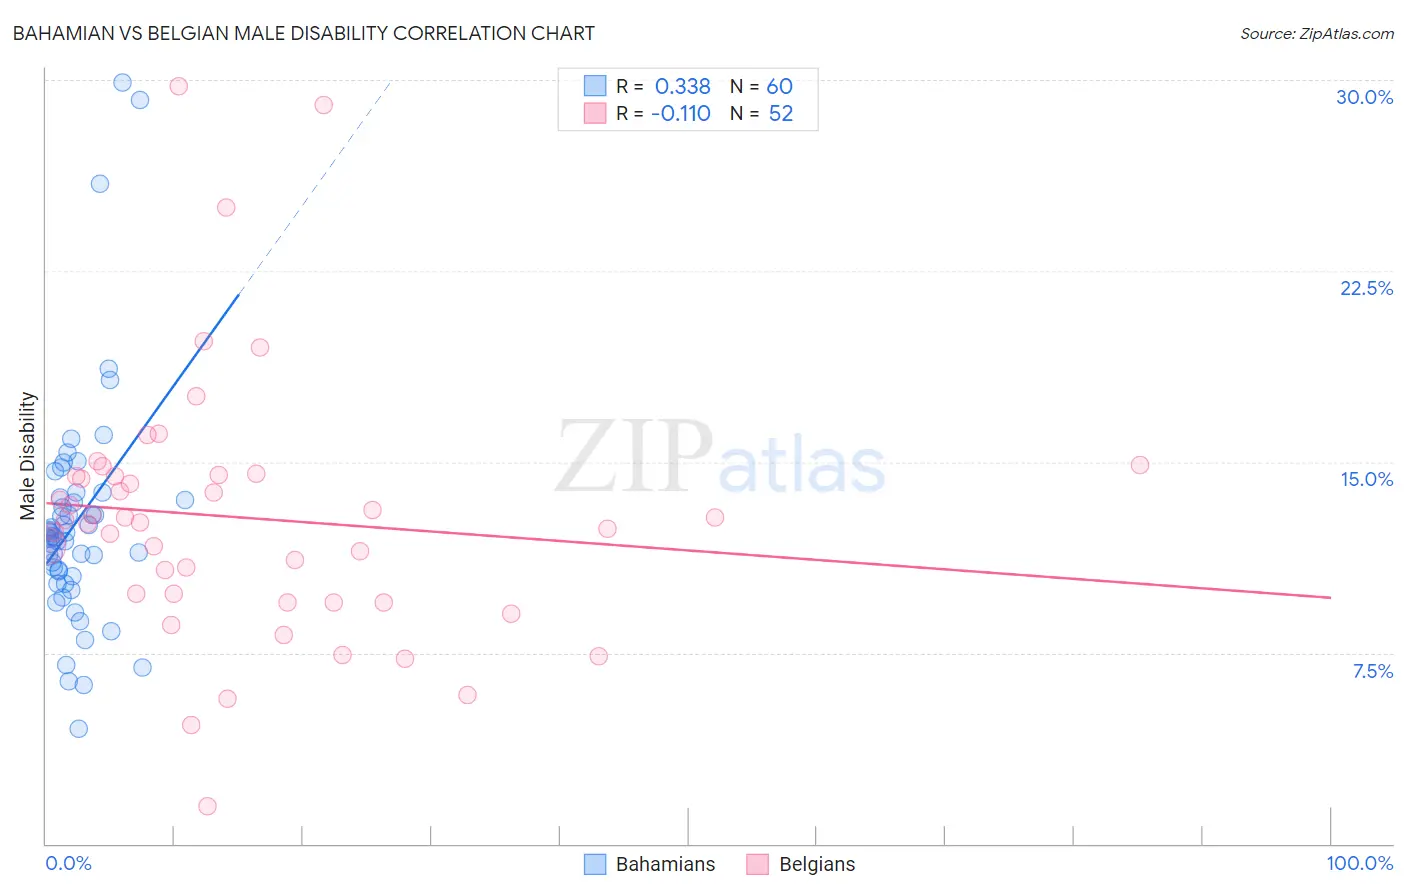
Bahamian vs Belgian Male Disability Correlation Chart
The statistical analysis conducted on geographies consisting of 112,681,735 people shows a mild positive correlation between the proportion of Bahamians and percentage of males with a disability in the United States with a correlation coefficient (R) of 0.338 and weighted average of 11.9%. Similarly, the statistical analysis conducted on geographies consisting of 355,990,096 people shows a poor negative correlation between the proportion of Belgians and percentage of males with a disability in the United States with a correlation coefficient (R) of -0.110 and weighted average of 12.1%, a difference of 1.8%.
Male Disability Correlation Summary
| Measurement | Bahamian | Belgian |
| Minimum | 4.5% | 1.4% |
| Maximum | 29.9% | 29.8% |
| Range | 25.4% | 28.3% |
| Mean | 12.6% | 12.8% |
| Median | 12.1% | 12.7% |
| Interquartile 25% (IQ1) | 10.6% | 9.7% |
| Interquartile 75% (IQ3) | 13.5% | 14.5% |
| Interquartile Range (IQR) | 2.9% | 4.8% |
| Standard Deviation (Sample) | 4.5% | 5.2% |
| Standard Deviation (Population) | 4.5% | 5.1% |
Demographics Similar to Bahamians and Belgians by Male Disability
In terms of male disability, the demographic groups most similar to Bahamians are Northern European (11.9%, a difference of 0.010%), Czech (11.9%, a difference of 0.040%), Samoan (11.9%, a difference of 0.040%), Immigrants from Laos (11.9%, a difference of 0.16%), and Immigrants from Liberia (11.9%, a difference of 0.16%). Similarly, the demographic groups most similar to Belgians are Basque (12.1%, a difference of 0.040%), Swedish (12.1%, a difference of 0.070%), Swiss (12.1%, a difference of 0.24%), European (12.1%, a difference of 0.24%), and Chinese (12.1%, a difference of 0.49%).
| Demographics | Rating | Rank | Male Disability |
| Czechs | 1.1 /100 | #240 | Tragic 11.9% |
| Bahamians | 1.1 /100 | #241 | Tragic 11.9% |
| Northern Europeans | 1.1 /100 | #242 | Tragic 11.9% |
| Samoans | 1.1 /100 | #243 | Tragic 11.9% |
| Immigrants | Laos | 1.0 /100 | #244 | Tragic 11.9% |
| Immigrants | Liberia | 1.0 /100 | #245 | Tragic 11.9% |
| Danes | 0.9 /100 | #246 | Tragic 11.9% |
| Hungarians | 0.8 /100 | #247 | Tragic 12.0% |
| Poles | 0.7 /100 | #248 | Tragic 12.0% |
| Immigrants | Yemen | 0.5 /100 | #249 | Tragic 12.0% |
| Bangladeshis | 0.5 /100 | #250 | Tragic 12.0% |
| German Russians | 0.5 /100 | #251 | Tragic 12.0% |
| Slovenes | 0.5 /100 | #252 | Tragic 12.0% |
| Guamanians/Chamorros | 0.5 /100 | #253 | Tragic 12.0% |
| British | 0.4 /100 | #254 | Tragic 12.1% |
| Chinese | 0.4 /100 | #255 | Tragic 12.1% |
| Swiss | 0.3 /100 | #256 | Tragic 12.1% |
| Europeans | 0.3 /100 | #257 | Tragic 12.1% |
| Basques | 0.3 /100 | #258 | Tragic 12.1% |
| Belgians | 0.3 /100 | #259 | Tragic 12.1% |
| Swedes | 0.3 /100 | #260 | Tragic 12.1% |