Austrian vs Peruvian Cognitive Disability
COMPARE
Austrian
Peruvian
Cognitive Disability
Cognitive Disability Comparison
Austrians
Peruvians
16.6%
COGNITIVE DISABILITY
99.7/ 100
METRIC RATING
56th/ 347
METRIC RANK
16.7%
COGNITIVE DISABILITY
99.3/ 100
METRIC RATING
78th/ 347
METRIC RANK
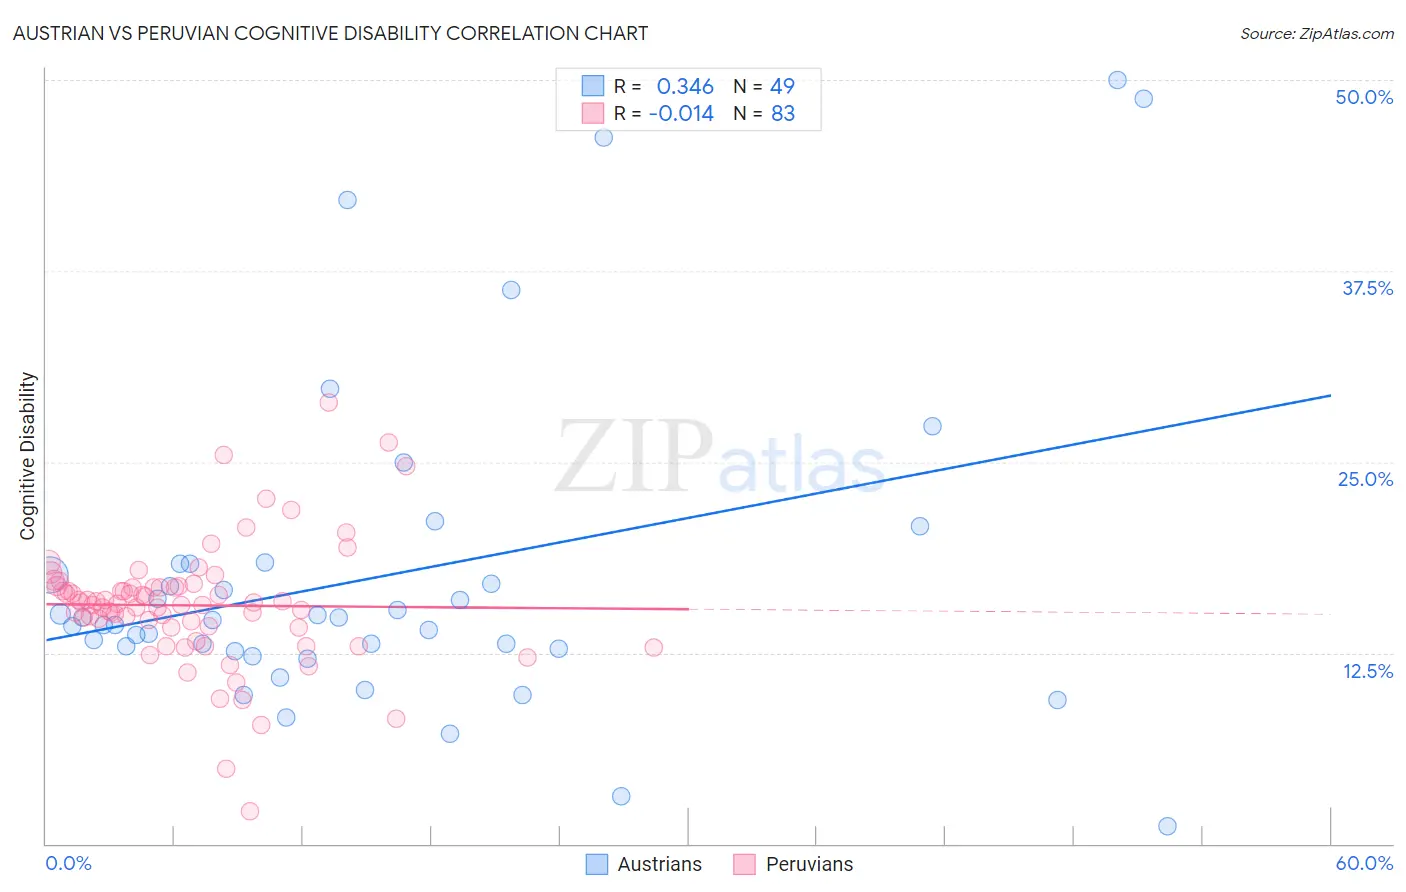
Austrian vs Peruvian Cognitive Disability Correlation Chart
The statistical analysis conducted on geographies consisting of 452,054,374 people shows a mild positive correlation between the proportion of Austrians and percentage of population with cognitive disability in the United States with a correlation coefficient (R) of 0.346 and weighted average of 16.6%. Similarly, the statistical analysis conducted on geographies consisting of 363,189,902 people shows no correlation between the proportion of Peruvians and percentage of population with cognitive disability in the United States with a correlation coefficient (R) of -0.014 and weighted average of 16.7%, a difference of 0.65%.
Cognitive Disability Correlation Summary
| Measurement | Austrian | Peruvian |
| Minimum | 1.2% | 2.1% |
| Maximum | 50.0% | 28.9% |
| Range | 48.8% | 26.8% |
| Mean | 17.6% | 15.6% |
| Median | 14.6% | 15.7% |
| Interquartile 25% (IQ1) | 12.7% | 14.2% |
| Interquartile 75% (IQ3) | 18.3% | 16.8% |
| Interquartile Range (IQR) | 5.6% | 2.6% |
| Standard Deviation (Sample) | 10.6% | 4.0% |
| Standard Deviation (Population) | 10.5% | 4.0% |
Similar Demographics by Cognitive Disability
Demographics Similar to Austrians by Cognitive Disability
In terms of cognitive disability, the demographic groups most similar to Austrians are Bhutanese (16.6%, a difference of 0.010%), Pennsylvania German (16.6%, a difference of 0.080%), Immigrants from Peru (16.6%, a difference of 0.080%), Immigrants from Venezuela (16.5%, a difference of 0.090%), and Romanian (16.6%, a difference of 0.090%).
| Demographics | Rating | Rank | Cognitive Disability |
| Iranians | 99.8 /100 | #49 | Exceptional 16.5% |
| Norwegians | 99.8 /100 | #50 | Exceptional 16.5% |
| Immigrants | Korea | 99.8 /100 | #51 | Exceptional 16.5% |
| Soviet Union | 99.8 /100 | #52 | Exceptional 16.5% |
| Swedes | 99.8 /100 | #53 | Exceptional 16.5% |
| Immigrants | Iran | 99.8 /100 | #54 | Exceptional 16.5% |
| Immigrants | Venezuela | 99.7 /100 | #55 | Exceptional 16.5% |
| Austrians | 99.7 /100 | #56 | Exceptional 16.6% |
| Bhutanese | 99.7 /100 | #57 | Exceptional 16.6% |
| Pennsylvania Germans | 99.7 /100 | #58 | Exceptional 16.6% |
| Immigrants | Peru | 99.7 /100 | #59 | Exceptional 16.6% |
| Romanians | 99.7 /100 | #60 | Exceptional 16.6% |
| Immigrants | England | 99.6 /100 | #61 | Exceptional 16.6% |
| Czechoslovakians | 99.6 /100 | #62 | Exceptional 16.6% |
| Argentineans | 99.6 /100 | #63 | Exceptional 16.6% |
Demographics Similar to Peruvians by Cognitive Disability
In terms of cognitive disability, the demographic groups most similar to Peruvians are Immigrants from Hungary (16.7%, a difference of 0.0%), Immigrants from Serbia (16.7%, a difference of 0.010%), Immigrants from Bulgaria (16.7%, a difference of 0.010%), Estonian (16.7%, a difference of 0.030%), and Egyptian (16.7%, a difference of 0.030%).
| Demographics | Rating | Rank | Cognitive Disability |
| Immigrants | Belgium | 99.3 /100 | #71 | Exceptional 16.7% |
| Germans | 99.3 /100 | #72 | Exceptional 16.7% |
| Burmese | 99.3 /100 | #73 | Exceptional 16.7% |
| Slavs | 99.3 /100 | #74 | Exceptional 16.7% |
| Estonians | 99.3 /100 | #75 | Exceptional 16.7% |
| Immigrants | Serbia | 99.3 /100 | #76 | Exceptional 16.7% |
| Immigrants | Hungary | 99.3 /100 | #77 | Exceptional 16.7% |
| Peruvians | 99.3 /100 | #78 | Exceptional 16.7% |
| Immigrants | Bulgaria | 99.3 /100 | #79 | Exceptional 16.7% |
| Egyptians | 99.2 /100 | #80 | Exceptional 16.7% |
| Immigrants | Netherlands | 99.2 /100 | #81 | Exceptional 16.7% |
| Swiss | 99.2 /100 | #82 | Exceptional 16.7% |
| Serbians | 99.1 /100 | #83 | Exceptional 16.7% |
| Belgians | 99.1 /100 | #84 | Exceptional 16.7% |
| Immigrants | Moldova | 99.1 /100 | #85 | Exceptional 16.7% |