Austrian vs Immigrants from Uzbekistan Cognitive Disability
COMPARE
Austrian
Immigrants from Uzbekistan
Cognitive Disability
Cognitive Disability Comparison
Austrians
Immigrants from Uzbekistan
16.6%
COGNITIVE DISABILITY
99.7/ 100
METRIC RATING
56th/ 347
METRIC RANK
16.7%
COGNITIVE DISABILITY
99.4/ 100
METRIC RATING
69th/ 347
METRIC RANK
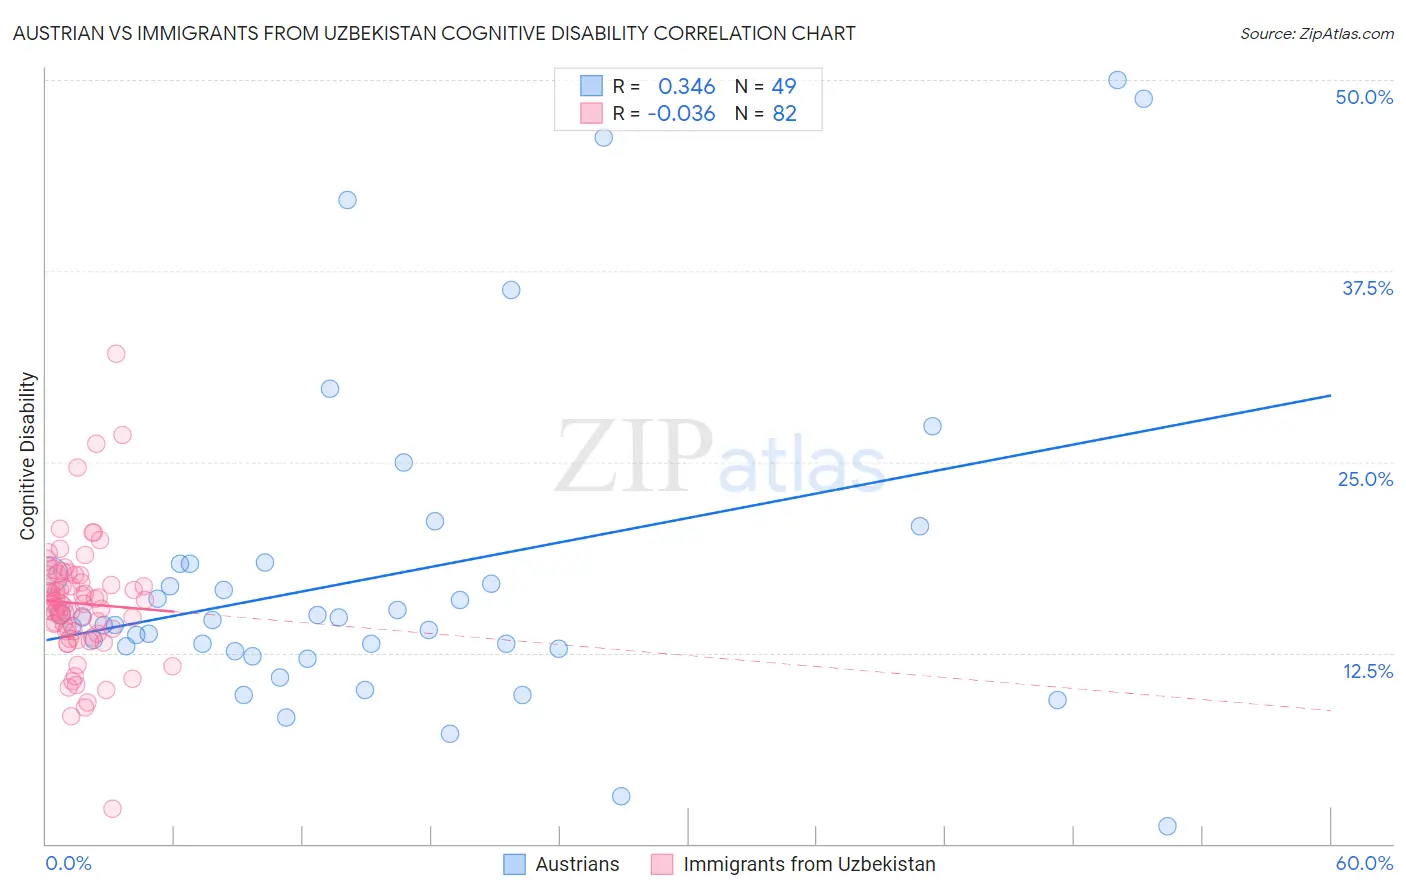
Austrian vs Immigrants from Uzbekistan Cognitive Disability Correlation Chart
The statistical analysis conducted on geographies consisting of 452,054,374 people shows a mild positive correlation between the proportion of Austrians and percentage of population with cognitive disability in the United States with a correlation coefficient (R) of 0.346 and weighted average of 16.6%. Similarly, the statistical analysis conducted on geographies consisting of 118,751,620 people shows no correlation between the proportion of Immigrants from Uzbekistan and percentage of population with cognitive disability in the United States with a correlation coefficient (R) of -0.036 and weighted average of 16.7%, a difference of 0.56%.
Cognitive Disability Correlation Summary
| Measurement | Austrian | Immigrants from Uzbekistan |
| Minimum | 1.2% | 2.3% |
| Maximum | 50.0% | 32.0% |
| Range | 48.8% | 29.7% |
| Mean | 17.6% | 15.7% |
| Median | 14.6% | 15.7% |
| Interquartile 25% (IQ1) | 12.7% | 13.9% |
| Interquartile 75% (IQ3) | 18.3% | 17.6% |
| Interquartile Range (IQR) | 5.6% | 3.7% |
| Standard Deviation (Sample) | 10.6% | 4.1% |
| Standard Deviation (Population) | 10.5% | 4.0% |
Demographics Similar to Austrians and Immigrants from Uzbekistan by Cognitive Disability
In terms of cognitive disability, the demographic groups most similar to Austrians are Bhutanese (16.6%, a difference of 0.010%), Pennsylvania German (16.6%, a difference of 0.080%), Immigrants from Peru (16.6%, a difference of 0.080%), Immigrants from Venezuela (16.5%, a difference of 0.090%), and Romanian (16.6%, a difference of 0.090%). Similarly, the demographic groups most similar to Immigrants from Uzbekistan are Immigrants from Sweden (16.7%, a difference of 0.010%), Immigrants from Belgium (16.7%, a difference of 0.020%), German (16.7%, a difference of 0.040%), Ukrainian (16.6%, a difference of 0.080%), and Latvian (16.6%, a difference of 0.12%).
| Demographics | Rating | Rank | Cognitive Disability |
| Soviet Union | 99.8 /100 | #52 | Exceptional 16.5% |
| Swedes | 99.8 /100 | #53 | Exceptional 16.5% |
| Immigrants | Iran | 99.8 /100 | #54 | Exceptional 16.5% |
| Immigrants | Venezuela | 99.7 /100 | #55 | Exceptional 16.5% |
| Austrians | 99.7 /100 | #56 | Exceptional 16.6% |
| Bhutanese | 99.7 /100 | #57 | Exceptional 16.6% |
| Pennsylvania Germans | 99.7 /100 | #58 | Exceptional 16.6% |
| Immigrants | Peru | 99.7 /100 | #59 | Exceptional 16.6% |
| Romanians | 99.7 /100 | #60 | Exceptional 16.6% |
| Immigrants | England | 99.6 /100 | #61 | Exceptional 16.6% |
| Czechoslovakians | 99.6 /100 | #62 | Exceptional 16.6% |
| Argentineans | 99.6 /100 | #63 | Exceptional 16.6% |
| Venezuelans | 99.6 /100 | #64 | Exceptional 16.6% |
| Colombians | 99.6 /100 | #65 | Exceptional 16.6% |
| Immigrants | Ukraine | 99.5 /100 | #66 | Exceptional 16.6% |
| Latvians | 99.5 /100 | #67 | Exceptional 16.6% |
| Ukrainians | 99.4 /100 | #68 | Exceptional 16.6% |
| Immigrants | Uzbekistan | 99.4 /100 | #69 | Exceptional 16.7% |
| Immigrants | Sweden | 99.4 /100 | #70 | Exceptional 16.7% |
| Immigrants | Belgium | 99.3 /100 | #71 | Exceptional 16.7% |
| Germans | 99.3 /100 | #72 | Exceptional 16.7% |