Austrian vs Immigrants from Latin America Cognitive Disability
COMPARE
Austrian
Immigrants from Latin America
Cognitive Disability
Cognitive Disability Comparison
Austrians
Immigrants from Latin America
16.6%
COGNITIVE DISABILITY
99.7/ 100
METRIC RATING
56th/ 347
METRIC RANK
17.6%
COGNITIVE DISABILITY
9.7/ 100
METRIC RATING
207th/ 347
METRIC RANK
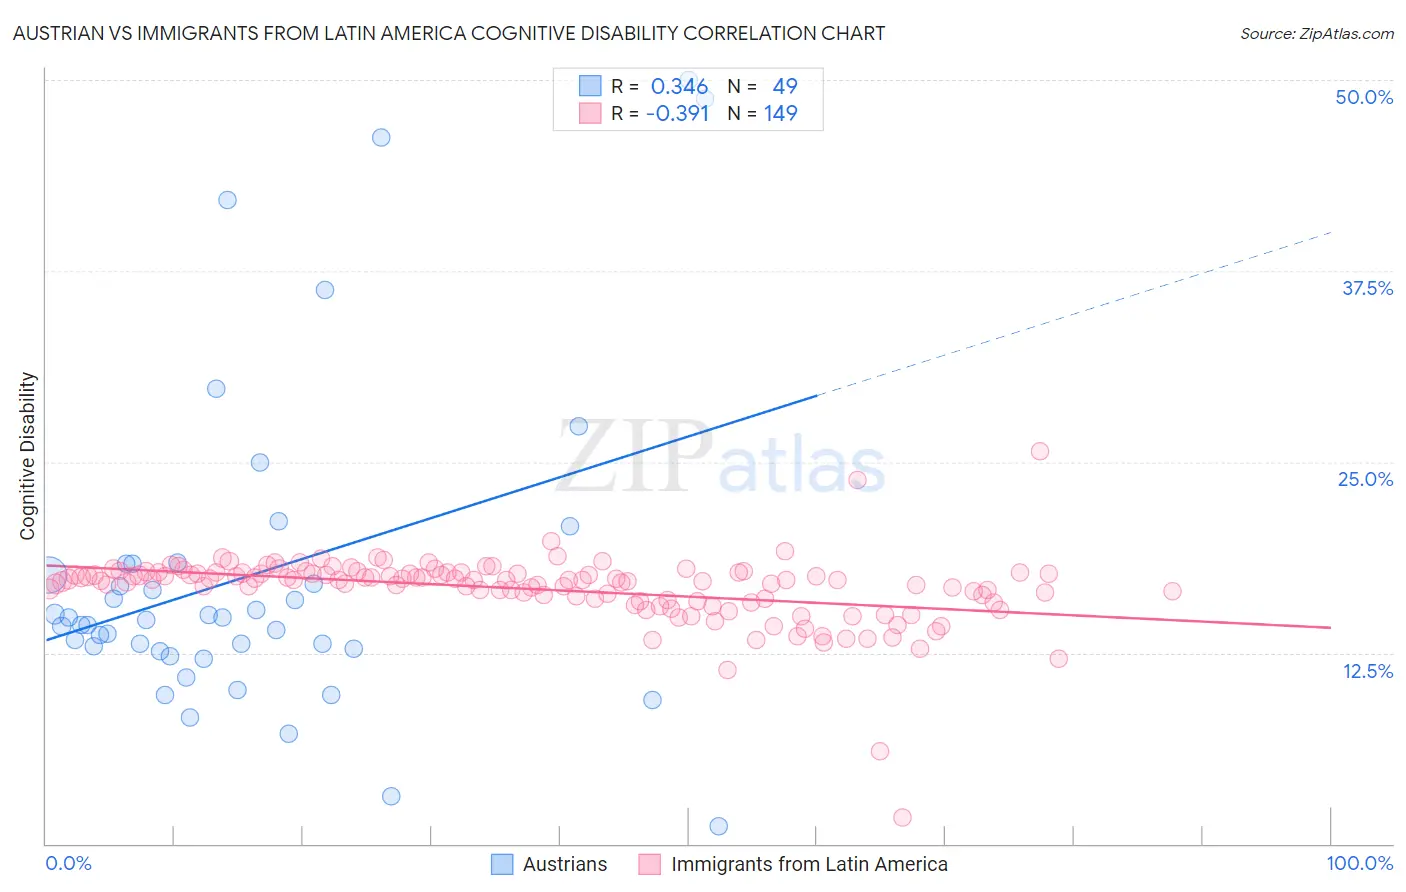
Austrian vs Immigrants from Latin America Cognitive Disability Correlation Chart
The statistical analysis conducted on geographies consisting of 452,054,374 people shows a mild positive correlation between the proportion of Austrians and percentage of population with cognitive disability in the United States with a correlation coefficient (R) of 0.346 and weighted average of 16.6%. Similarly, the statistical analysis conducted on geographies consisting of 558,464,403 people shows a mild negative correlation between the proportion of Immigrants from Latin America and percentage of population with cognitive disability in the United States with a correlation coefficient (R) of -0.391 and weighted average of 17.6%, a difference of 6.0%.
Cognitive Disability Correlation Summary
| Measurement | Austrian | Immigrants from Latin America |
| Minimum | 1.2% | 1.8% |
| Maximum | 50.0% | 25.7% |
| Range | 48.8% | 23.9% |
| Mean | 17.6% | 16.7% |
| Median | 14.6% | 17.3% |
| Interquartile 25% (IQ1) | 12.7% | 16.0% |
| Interquartile 75% (IQ3) | 18.3% | 17.7% |
| Interquartile Range (IQR) | 5.6% | 1.7% |
| Standard Deviation (Sample) | 10.6% | 2.3% |
| Standard Deviation (Population) | 10.5% | 2.3% |
Similar Demographics by Cognitive Disability
Demographics Similar to Austrians by Cognitive Disability
In terms of cognitive disability, the demographic groups most similar to Austrians are Bhutanese (16.6%, a difference of 0.010%), Pennsylvania German (16.6%, a difference of 0.080%), Immigrants from Peru (16.6%, a difference of 0.080%), Immigrants from Venezuela (16.5%, a difference of 0.090%), and Romanian (16.6%, a difference of 0.090%).
| Demographics | Rating | Rank | Cognitive Disability |
| Iranians | 99.8 /100 | #49 | Exceptional 16.5% |
| Norwegians | 99.8 /100 | #50 | Exceptional 16.5% |
| Immigrants | Korea | 99.8 /100 | #51 | Exceptional 16.5% |
| Soviet Union | 99.8 /100 | #52 | Exceptional 16.5% |
| Swedes | 99.8 /100 | #53 | Exceptional 16.5% |
| Immigrants | Iran | 99.8 /100 | #54 | Exceptional 16.5% |
| Immigrants | Venezuela | 99.7 /100 | #55 | Exceptional 16.5% |
| Austrians | 99.7 /100 | #56 | Exceptional 16.6% |
| Bhutanese | 99.7 /100 | #57 | Exceptional 16.6% |
| Pennsylvania Germans | 99.7 /100 | #58 | Exceptional 16.6% |
| Immigrants | Peru | 99.7 /100 | #59 | Exceptional 16.6% |
| Romanians | 99.7 /100 | #60 | Exceptional 16.6% |
| Immigrants | England | 99.6 /100 | #61 | Exceptional 16.6% |
| Czechoslovakians | 99.6 /100 | #62 | Exceptional 16.6% |
| Argentineans | 99.6 /100 | #63 | Exceptional 16.6% |
Demographics Similar to Immigrants from Latin America by Cognitive Disability
In terms of cognitive disability, the demographic groups most similar to Immigrants from Latin America are Immigrants from Cameroon (17.6%, a difference of 0.030%), Alaska Native (17.5%, a difference of 0.050%), Immigrants from Trinidad and Tobago (17.6%, a difference of 0.080%), Puget Sound Salish (17.5%, a difference of 0.090%), and Immigrants from Caribbean (17.5%, a difference of 0.10%).
| Demographics | Rating | Rank | Cognitive Disability |
| Haitians | 14.1 /100 | #200 | Poor 17.5% |
| South American Indians | 13.0 /100 | #201 | Poor 17.5% |
| Immigrants | Morocco | 12.0 /100 | #202 | Poor 17.5% |
| Immigrants | Caribbean | 11.0 /100 | #203 | Poor 17.5% |
| Immigrants | Zimbabwe | 11.0 /100 | #204 | Poor 17.5% |
| Puget Sound Salish | 10.9 /100 | #205 | Poor 17.5% |
| Alaska Natives | 10.4 /100 | #206 | Poor 17.5% |
| Immigrants | Latin America | 9.7 /100 | #207 | Tragic 17.6% |
| Immigrants | Cameroon | 9.3 /100 | #208 | Tragic 17.6% |
| Immigrants | Trinidad and Tobago | 8.7 /100 | #209 | Tragic 17.6% |
| Immigrants | Jamaica | 8.5 /100 | #210 | Tragic 17.6% |
| Taiwanese | 7.7 /100 | #211 | Tragic 17.6% |
| Immigrants | Oceania | 7.3 /100 | #212 | Tragic 17.6% |
| Hawaiians | 7.2 /100 | #213 | Tragic 17.6% |
| Immigrants | El Salvador | 7.0 /100 | #214 | Tragic 17.6% |