Austrian vs Czech Cognitive Disability
COMPARE
Austrian
Czech
Cognitive Disability
Cognitive Disability Comparison
Austrians
Czechs
16.6%
COGNITIVE DISABILITY
99.7/ 100
METRIC RATING
56th/ 347
METRIC RANK
16.4%
COGNITIVE DISABILITY
99.9/ 100
METRIC RATING
30th/ 347
METRIC RANK
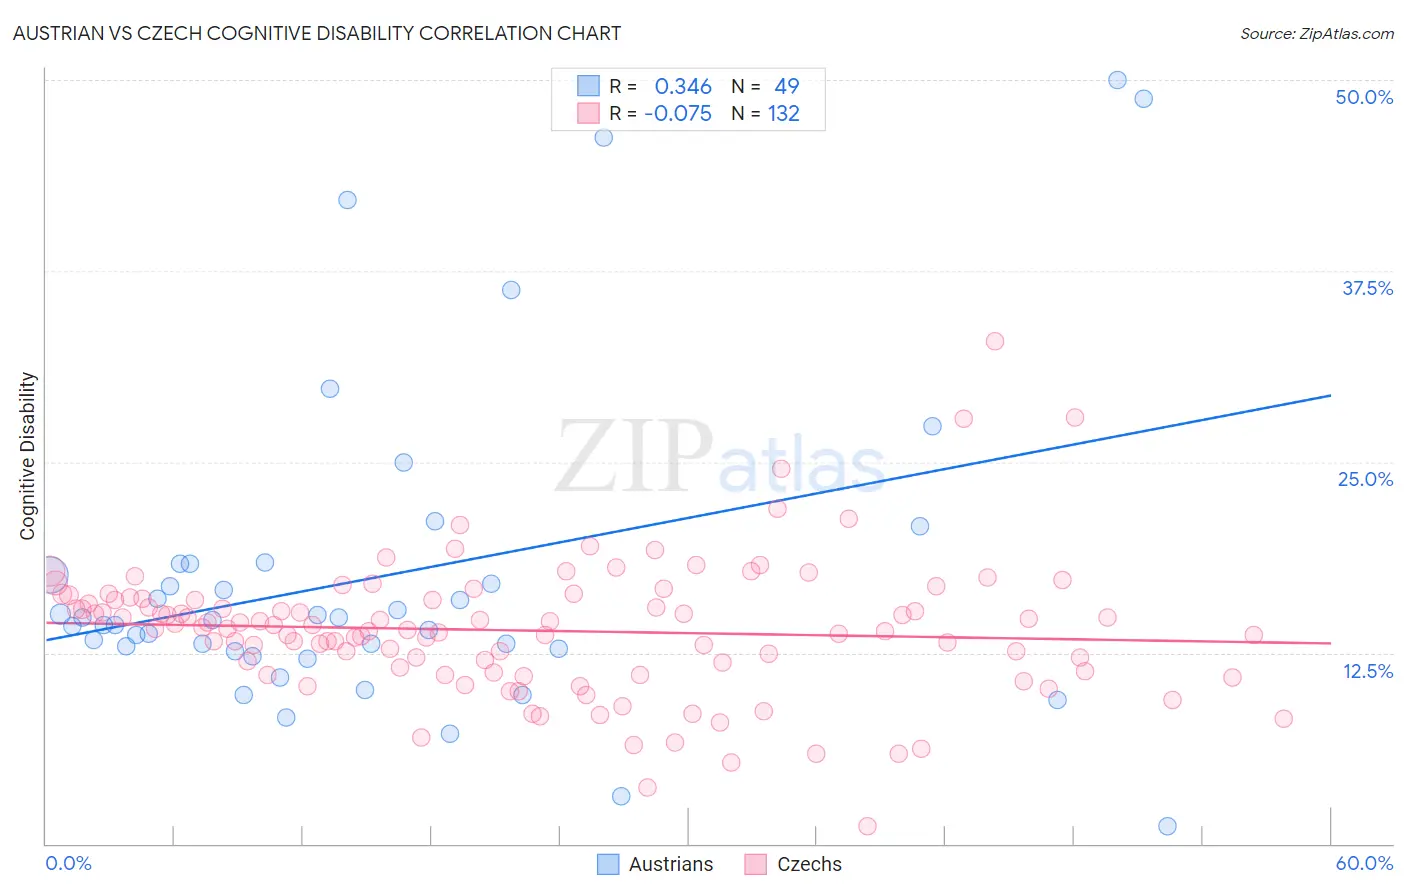
Austrian vs Czech Cognitive Disability Correlation Chart
The statistical analysis conducted on geographies consisting of 452,054,374 people shows a mild positive correlation between the proportion of Austrians and percentage of population with cognitive disability in the United States with a correlation coefficient (R) of 0.346 and weighted average of 16.6%. Similarly, the statistical analysis conducted on geographies consisting of 484,743,035 people shows a slight negative correlation between the proportion of Czechs and percentage of population with cognitive disability in the United States with a correlation coefficient (R) of -0.075 and weighted average of 16.4%, a difference of 1.1%.
Cognitive Disability Correlation Summary
| Measurement | Austrian | Czech |
| Minimum | 1.2% | 1.2% |
| Maximum | 50.0% | 32.9% |
| Range | 48.8% | 31.7% |
| Mean | 17.6% | 14.0% |
| Median | 14.6% | 14.1% |
| Interquartile 25% (IQ1) | 12.7% | 11.4% |
| Interquartile 75% (IQ3) | 18.3% | 16.0% |
| Interquartile Range (IQR) | 5.6% | 4.6% |
| Standard Deviation (Sample) | 10.6% | 4.4% |
| Standard Deviation (Population) | 10.5% | 4.4% |
Similar Demographics by Cognitive Disability
Demographics Similar to Austrians by Cognitive Disability
In terms of cognitive disability, the demographic groups most similar to Austrians are Bhutanese (16.6%, a difference of 0.010%), Pennsylvania German (16.6%, a difference of 0.080%), Immigrants from Peru (16.6%, a difference of 0.080%), Immigrants from Venezuela (16.5%, a difference of 0.090%), and Romanian (16.6%, a difference of 0.090%).
| Demographics | Rating | Rank | Cognitive Disability |
| Iranians | 99.8 /100 | #49 | Exceptional 16.5% |
| Norwegians | 99.8 /100 | #50 | Exceptional 16.5% |
| Immigrants | Korea | 99.8 /100 | #51 | Exceptional 16.5% |
| Soviet Union | 99.8 /100 | #52 | Exceptional 16.5% |
| Swedes | 99.8 /100 | #53 | Exceptional 16.5% |
| Immigrants | Iran | 99.8 /100 | #54 | Exceptional 16.5% |
| Immigrants | Venezuela | 99.7 /100 | #55 | Exceptional 16.5% |
| Austrians | 99.7 /100 | #56 | Exceptional 16.6% |
| Bhutanese | 99.7 /100 | #57 | Exceptional 16.6% |
| Pennsylvania Germans | 99.7 /100 | #58 | Exceptional 16.6% |
| Immigrants | Peru | 99.7 /100 | #59 | Exceptional 16.6% |
| Romanians | 99.7 /100 | #60 | Exceptional 16.6% |
| Immigrants | England | 99.6 /100 | #61 | Exceptional 16.6% |
| Czechoslovakians | 99.6 /100 | #62 | Exceptional 16.6% |
| Argentineans | 99.6 /100 | #63 | Exceptional 16.6% |
Demographics Similar to Czechs by Cognitive Disability
In terms of cognitive disability, the demographic groups most similar to Czechs are Filipino (16.4%, a difference of 0.0%), Immigrants from Romania (16.4%, a difference of 0.020%), Immigrants from Pakistan (16.4%, a difference of 0.030%), Polish (16.4%, a difference of 0.030%), and Immigrants from Croatia (16.4%, a difference of 0.050%).
| Demographics | Rating | Rank | Cognitive Disability |
| Croatians | 99.9 /100 | #23 | Exceptional 16.4% |
| Immigrants | Argentina | 99.9 /100 | #24 | Exceptional 16.4% |
| Luxembourgers | 99.9 /100 | #25 | Exceptional 16.4% |
| Immigrants | Croatia | 99.9 /100 | #26 | Exceptional 16.4% |
| Immigrants | Pakistan | 99.9 /100 | #27 | Exceptional 16.4% |
| Poles | 99.9 /100 | #28 | Exceptional 16.4% |
| Filipinos | 99.9 /100 | #29 | Exceptional 16.4% |
| Czechs | 99.9 /100 | #30 | Exceptional 16.4% |
| Immigrants | Romania | 99.9 /100 | #31 | Exceptional 16.4% |
| Immigrants | Israel | 99.9 /100 | #32 | Exceptional 16.4% |
| Italians | 99.9 /100 | #33 | Exceptional 16.4% |
| Russians | 99.9 /100 | #34 | Exceptional 16.4% |
| Slovaks | 99.9 /100 | #35 | Exceptional 16.4% |
| Greeks | 99.9 /100 | #36 | Exceptional 16.4% |
| Slovenes | 99.9 /100 | #37 | Exceptional 16.5% |