Australian vs Central American Disability Age Under 5
COMPARE
Australian
Central American
Disability Age Under 5
Disability Age Under 5 Comparison
Australians
Central Americans
1.4%
DISABILITY AGE UNDER 5
0.7/ 100
METRIC RATING
253rd/ 347
METRIC RANK
1.2%
DISABILITY AGE UNDER 5
89.7/ 100
METRIC RATING
126th/ 347
METRIC RANK
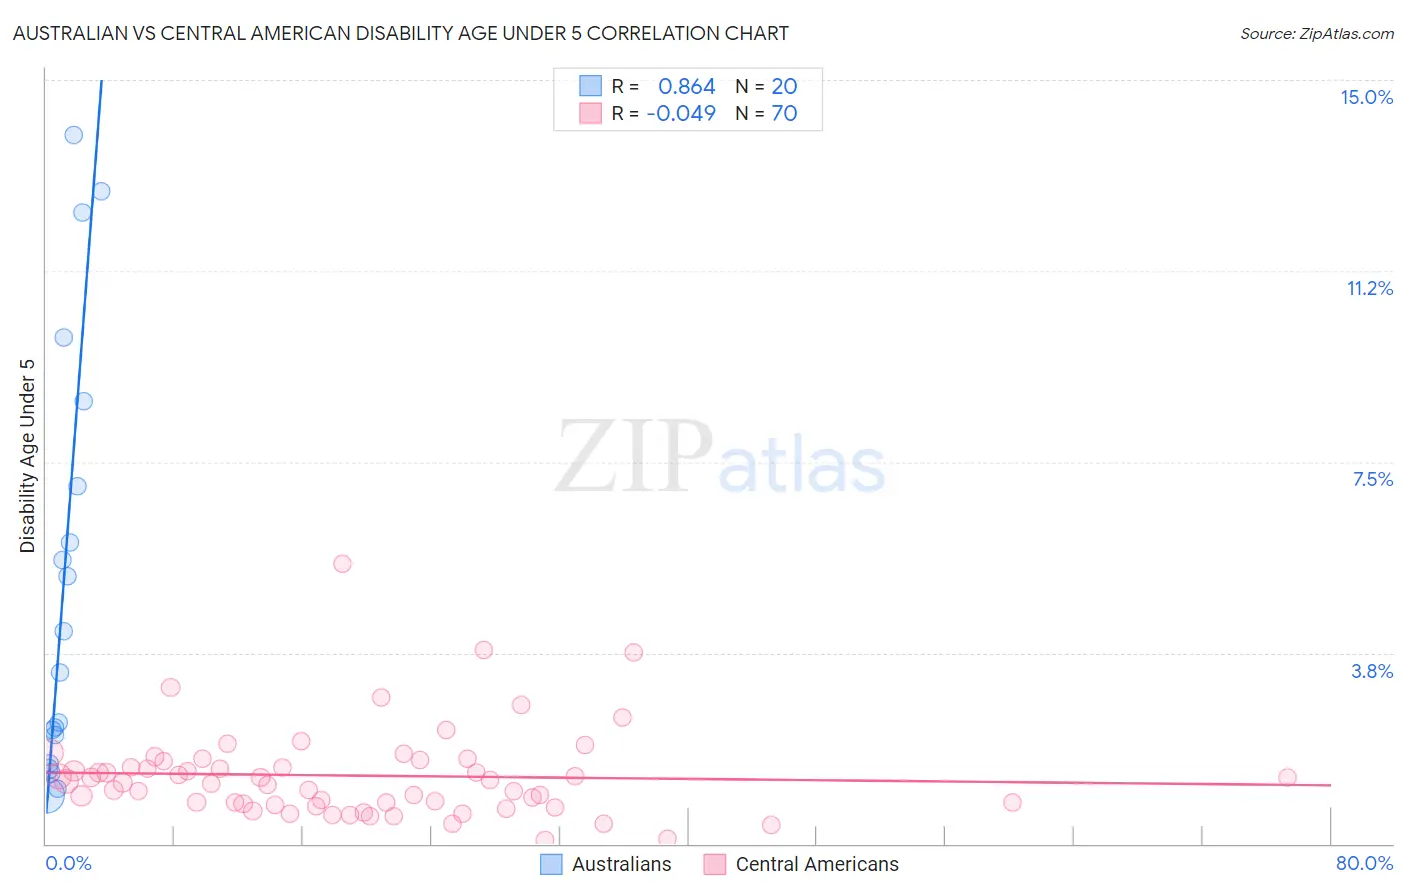
Australian vs Central American Disability Age Under 5 Correlation Chart
The statistical analysis conducted on geographies consisting of 142,562,504 people shows a very strong positive correlation between the proportion of Australians and percentage of population with a disability under the age of 5 in the United States with a correlation coefficient (R) of 0.864 and weighted average of 1.4%. Similarly, the statistical analysis conducted on geographies consisting of 251,619,686 people shows no correlation between the proportion of Central Americans and percentage of population with a disability under the age of 5 in the United States with a correlation coefficient (R) of -0.049 and weighted average of 1.2%, a difference of 17.0%.
Disability Age Under 5 Correlation Summary
| Measurement | Australian | Central American |
| Minimum | 0.96% | 0.078% |
| Maximum | 13.9% | 5.5% |
| Range | 13.0% | 5.4% |
| Mean | 5.2% | 1.3% |
| Median | 3.8% | 1.2% |
| Interquartile 25% (IQ1) | 1.9% | 0.79% |
| Interquartile 75% (IQ3) | 7.9% | 1.6% |
| Interquartile Range (IQR) | 6.0% | 0.84% |
| Standard Deviation (Sample) | 4.2% | 0.90% |
| Standard Deviation (Population) | 4.1% | 0.89% |
Similar Demographics by Disability Age Under 5
Demographics Similar to Australians by Disability Age Under 5
In terms of disability age under 5, the demographic groups most similar to Australians are Immigrants from Brazil (1.4%, a difference of 0.080%), Immigrants from Liberia (1.4%, a difference of 0.14%), Immigrants from Western Europe (1.4%, a difference of 0.56%), Immigrants from Scotland (1.4%, a difference of 0.67%), and Immigrants from Hungary (1.4%, a difference of 0.72%).
| Demographics | Rating | Rank | Disability Age Under 5 |
| Russians | 1.0 /100 | #246 | Tragic 1.4% |
| Immigrants | England | 1.0 /100 | #247 | Tragic 1.4% |
| Eastern Europeans | 1.0 /100 | #248 | Tragic 1.4% |
| Bermudans | 1.0 /100 | #249 | Tragic 1.4% |
| Africans | 1.0 /100 | #250 | Tragic 1.4% |
| Immigrants | Hungary | 1.0 /100 | #251 | Tragic 1.4% |
| Immigrants | Scotland | 0.9 /100 | #252 | Tragic 1.4% |
| Australians | 0.7 /100 | #253 | Tragic 1.4% |
| Immigrants | Brazil | 0.7 /100 | #254 | Tragic 1.4% |
| Immigrants | Liberia | 0.6 /100 | #255 | Tragic 1.4% |
| Immigrants | Western Europe | 0.5 /100 | #256 | Tragic 1.4% |
| Slovenes | 0.3 /100 | #257 | Tragic 1.4% |
| Costa Ricans | 0.3 /100 | #258 | Tragic 1.4% |
| Immigrants | Southern Europe | 0.3 /100 | #259 | Tragic 1.4% |
| Slavs | 0.3 /100 | #260 | Tragic 1.4% |
Demographics Similar to Central Americans by Disability Age Under 5
In terms of disability age under 5, the demographic groups most similar to Central Americans are Japanese (1.2%, a difference of 0.16%), Immigrants from Cambodia (1.2%, a difference of 0.22%), Zimbabwean (1.2%, a difference of 0.25%), Aleut (1.2%, a difference of 0.29%), and Immigrants from Romania (1.2%, a difference of 0.30%).
| Demographics | Rating | Rank | Disability Age Under 5 |
| Bhutanese | 92.5 /100 | #119 | Exceptional 1.2% |
| Immigrants | Eritrea | 92.3 /100 | #120 | Exceptional 1.2% |
| Immigrants | Senegal | 91.4 /100 | #121 | Exceptional 1.2% |
| Aleuts | 90.7 /100 | #122 | Exceptional 1.2% |
| Zimbabweans | 90.6 /100 | #123 | Exceptional 1.2% |
| Immigrants | Cambodia | 90.5 /100 | #124 | Exceptional 1.2% |
| Japanese | 90.3 /100 | #125 | Exceptional 1.2% |
| Central Americans | 89.7 /100 | #126 | Excellent 1.2% |
| Immigrants | Romania | 88.4 /100 | #127 | Excellent 1.2% |
| Immigrants | France | 88.4 /100 | #128 | Excellent 1.2% |
| Immigrants | Immigrants | 88.0 /100 | #129 | Excellent 1.2% |
| Koreans | 87.7 /100 | #130 | Excellent 1.2% |
| Immigrants | Serbia | 87.6 /100 | #131 | Excellent 1.2% |
| Immigrants | Eastern Europe | 87.3 /100 | #132 | Excellent 1.2% |
| Immigrants | Spain | 86.5 /100 | #133 | Excellent 1.2% |