Australian vs Immigrants from Afghanistan Ambulatory Disability
COMPARE
Australian
Immigrants from Afghanistan
Ambulatory Disability
Ambulatory Disability Comparison
Australians
Immigrants from Afghanistan
5.8%
AMBULATORY DISABILITY
98.8/ 100
METRIC RATING
90th/ 347
METRIC RANK
5.6%
AMBULATORY DISABILITY
99.8/ 100
METRIC RATING
59th/ 347
METRIC RANK
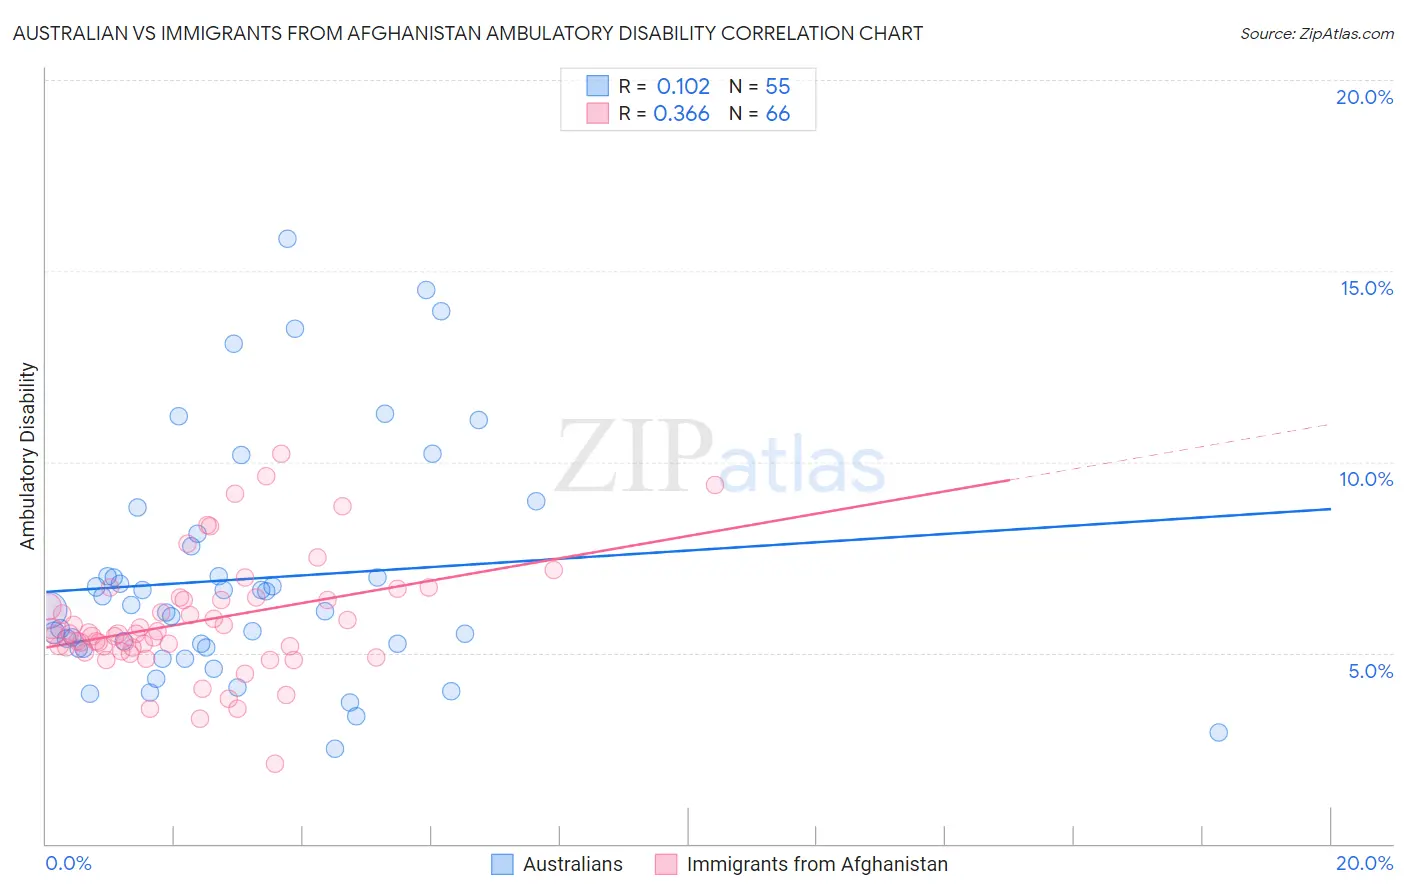
Australian vs Immigrants from Afghanistan Ambulatory Disability Correlation Chart
The statistical analysis conducted on geographies consisting of 224,102,055 people shows a poor positive correlation between the proportion of Australians and percentage of population with ambulatory disability in the United States with a correlation coefficient (R) of 0.102 and weighted average of 5.8%. Similarly, the statistical analysis conducted on geographies consisting of 147,636,321 people shows a mild positive correlation between the proportion of Immigrants from Afghanistan and percentage of population with ambulatory disability in the United States with a correlation coefficient (R) of 0.366 and weighted average of 5.6%, a difference of 2.3%.
Ambulatory Disability Correlation Summary
| Measurement | Australian | Immigrants from Afghanistan |
| Minimum | 2.5% | 2.1% |
| Maximum | 15.8% | 10.2% |
| Range | 13.3% | 8.1% |
| Mean | 6.9% | 5.8% |
| Median | 6.1% | 5.5% |
| Interquartile 25% (IQ1) | 5.1% | 5.1% |
| Interquartile 75% (IQ3) | 7.8% | 6.4% |
| Interquartile Range (IQR) | 2.7% | 1.3% |
| Standard Deviation (Sample) | 3.0% | 1.5% |
| Standard Deviation (Population) | 3.0% | 1.5% |
Similar Demographics by Ambulatory Disability
Demographics Similar to Australians by Ambulatory Disability
In terms of ambulatory disability, the demographic groups most similar to Australians are Bhutanese (5.8%, a difference of 0.0%), Immigrants from Sudan (5.8%, a difference of 0.0%), Soviet Union (5.8%, a difference of 0.12%), Immigrants from Chile (5.8%, a difference of 0.16%), and Immigrants from Sierra Leone (5.8%, a difference of 0.17%).
| Demographics | Rating | Rank | Ambulatory Disability |
| Eastern Europeans | 99.2 /100 | #83 | Exceptional 5.7% |
| Ugandans | 99.2 /100 | #84 | Exceptional 5.7% |
| South Americans | 99.0 /100 | #85 | Exceptional 5.7% |
| Latvians | 99.0 /100 | #86 | Exceptional 5.7% |
| Immigrants | Chile | 98.9 /100 | #87 | Exceptional 5.8% |
| Soviet Union | 98.9 /100 | #88 | Exceptional 5.8% |
| Bhutanese | 98.8 /100 | #89 | Exceptional 5.8% |
| Australians | 98.8 /100 | #90 | Exceptional 5.8% |
| Immigrants | Sudan | 98.8 /100 | #91 | Exceptional 5.8% |
| Immigrants | Sierra Leone | 98.6 /100 | #92 | Exceptional 5.8% |
| Immigrants | Denmark | 98.6 /100 | #93 | Exceptional 5.8% |
| Kenyans | 98.4 /100 | #94 | Exceptional 5.8% |
| Immigrants | El Salvador | 98.4 /100 | #95 | Exceptional 5.8% |
| Salvadorans | 98.4 /100 | #96 | Exceptional 5.8% |
| Immigrants | Somalia | 98.3 /100 | #97 | Exceptional 5.8% |
Demographics Similar to Immigrants from Afghanistan by Ambulatory Disability
In terms of ambulatory disability, the demographic groups most similar to Immigrants from Afghanistan are Immigrants from Zimbabwe (5.6%, a difference of 0.040%), Immigrants from Lithuania (5.6%, a difference of 0.040%), Immigrants from Brazil (5.6%, a difference of 0.10%), Immigrants from Belgium (5.6%, a difference of 0.16%), and Immigrants from Spain (5.6%, a difference of 0.17%).
| Demographics | Rating | Rank | Ambulatory Disability |
| Jordanians | 99.8 /100 | #52 | Exceptional 5.6% |
| Immigrants | Egypt | 99.8 /100 | #53 | Exceptional 5.6% |
| Immigrants | Eastern Africa | 99.8 /100 | #54 | Exceptional 5.6% |
| Immigrants | Bulgaria | 99.8 /100 | #55 | Exceptional 5.6% |
| Inupiat | 99.8 /100 | #56 | Exceptional 5.6% |
| Immigrants | Brazil | 99.8 /100 | #57 | Exceptional 5.6% |
| Immigrants | Zimbabwe | 99.8 /100 | #58 | Exceptional 5.6% |
| Immigrants | Afghanistan | 99.8 /100 | #59 | Exceptional 5.6% |
| Immigrants | Lithuania | 99.8 /100 | #60 | Exceptional 5.6% |
| Immigrants | Belgium | 99.7 /100 | #61 | Exceptional 5.6% |
| Immigrants | Spain | 99.7 /100 | #62 | Exceptional 5.6% |
| Immigrants | France | 99.7 /100 | #63 | Exceptional 5.6% |
| Laotians | 99.7 /100 | #64 | Exceptional 5.7% |
| Immigrants | Switzerland | 99.7 /100 | #65 | Exceptional 5.7% |
| Israelis | 99.6 /100 | #66 | Exceptional 5.7% |