Peruvian vs Immigrants from Zaire Disability Age Over 75
COMPARE
Peruvian
Immigrants from Zaire
Disability Age Over 75
Disability Age Over 75 Comparison
Peruvians
Immigrants from Zaire
46.8%
DISABILITY AGE OVER 75
86.5/ 100
METRIC RATING
142nd/ 347
METRIC RANK
47.1%
DISABILITY AGE OVER 75
74.8/ 100
METRIC RATING
153rd/ 347
METRIC RANK
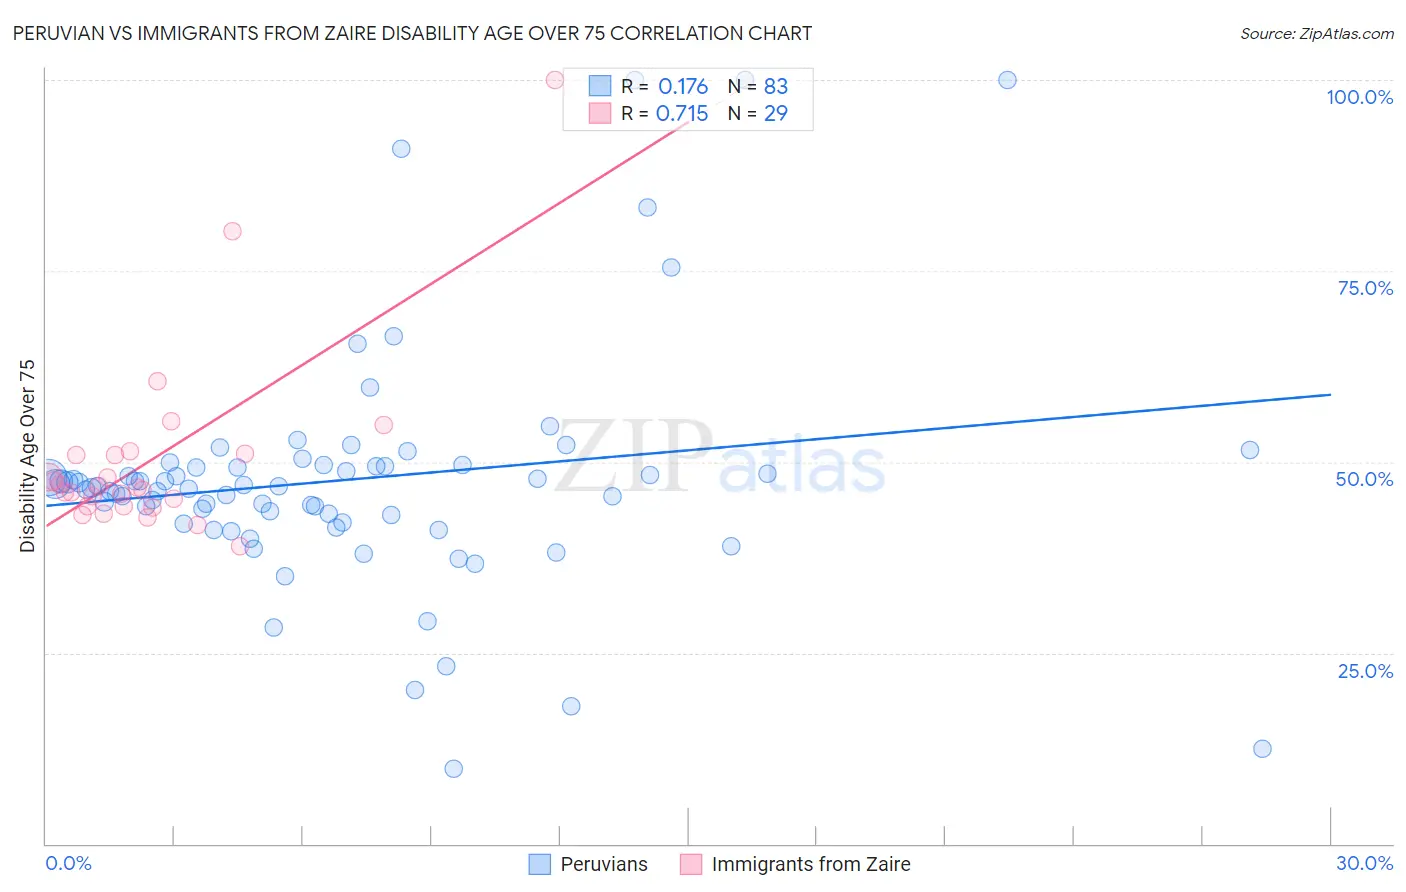
Peruvian vs Immigrants from Zaire Disability Age Over 75 Correlation Chart
The statistical analysis conducted on geographies consisting of 362,503,008 people shows a poor positive correlation between the proportion of Peruvians and percentage of population with a disability over the age of 75 in the United States with a correlation coefficient (R) of 0.176 and weighted average of 46.8%. Similarly, the statistical analysis conducted on geographies consisting of 107,207,758 people shows a strong positive correlation between the proportion of Immigrants from Zaire and percentage of population with a disability over the age of 75 in the United States with a correlation coefficient (R) of 0.715 and weighted average of 47.1%, a difference of 0.43%.
Disability Age Over 75 Correlation Summary
| Measurement | Peruvian | Immigrants from Zaire |
| Minimum | 9.9% | 39.0% |
| Maximum | 100.0% | 100.0% |
| Range | 90.1% | 61.0% |
| Mean | 47.6% | 50.2% |
| Median | 46.8% | 46.6% |
| Interquartile 25% (IQ1) | 42.1% | 44.2% |
| Interquartile 75% (IQ3) | 49.4% | 51.0% |
| Interquartile Range (IQR) | 7.3% | 6.8% |
| Standard Deviation (Sample) | 15.6% | 12.2% |
| Standard Deviation (Population) | 15.5% | 12.0% |
Demographics Similar to Peruvians and Immigrants from Zaire by Disability Age Over 75
In terms of disability age over 75, the demographic groups most similar to Peruvians are Lebanese (46.8%, a difference of 0.020%), Bermudan (46.9%, a difference of 0.040%), Immigrants from Costa Rica (46.8%, a difference of 0.050%), Venezuelan (46.9%, a difference of 0.070%), and Costa Rican (46.9%, a difference of 0.090%). Similarly, the demographic groups most similar to Immigrants from Zaire are Immigrants from Belarus (47.1%, a difference of 0.0%), Immigrants from Iran (47.1%, a difference of 0.010%), Arab (47.1%, a difference of 0.040%), Immigrants from Asia (47.0%, a difference of 0.050%), and Bhutanese (47.1%, a difference of 0.070%).
| Demographics | Rating | Rank | Disability Age Over 75 |
| Immigrants | Uganda | 88.5 /100 | #137 | Excellent 46.8% |
| Immigrants | Bosnia and Herzegovina | 88.5 /100 | #138 | Excellent 46.8% |
| Yugoslavians | 88.5 /100 | #139 | Excellent 46.8% |
| Immigrants | Costa Rica | 87.4 /100 | #140 | Excellent 46.8% |
| Lebanese | 87.0 /100 | #141 | Excellent 46.8% |
| Peruvians | 86.5 /100 | #142 | Excellent 46.8% |
| Bermudans | 85.6 /100 | #143 | Excellent 46.9% |
| Venezuelans | 85.0 /100 | #144 | Excellent 46.9% |
| Costa Ricans | 84.5 /100 | #145 | Excellent 46.9% |
| Guyanese | 84.3 /100 | #146 | Excellent 46.9% |
| Immigrants | Peru | 84.1 /100 | #147 | Excellent 46.9% |
| Asians | 81.6 /100 | #148 | Excellent 46.9% |
| Welsh | 81.3 /100 | #149 | Excellent 47.0% |
| Immigrants | Russia | 79.3 /100 | #150 | Good 47.0% |
| French Canadians | 79.0 /100 | #151 | Good 47.0% |
| Immigrants | Asia | 76.5 /100 | #152 | Good 47.0% |
| Immigrants | Zaire | 74.8 /100 | #153 | Good 47.1% |
| Immigrants | Belarus | 74.8 /100 | #154 | Good 47.1% |
| Immigrants | Iran | 74.7 /100 | #155 | Good 47.1% |
| Arabs | 73.3 /100 | #156 | Good 47.1% |
| Bhutanese | 72.6 /100 | #157 | Good 47.1% |