Assyrian/Chaldean/Syriac vs Immigrants from Zaire In Labor Force | Age 25-29
COMPARE
Assyrian/Chaldean/Syriac
Immigrants from Zaire
In Labor Force | Age 25-29
In Labor Force | Age 25-29 Comparison
Assyrians/Chaldeans/Syriacs
Immigrants from Zaire
84.7%
IN LABOR FORCE | AGE 25-29
50.2/ 100
METRIC RATING
173rd/ 347
METRIC RANK
85.1%
IN LABOR FORCE | AGE 25-29
93.3/ 100
METRIC RATING
104th/ 347
METRIC RANK
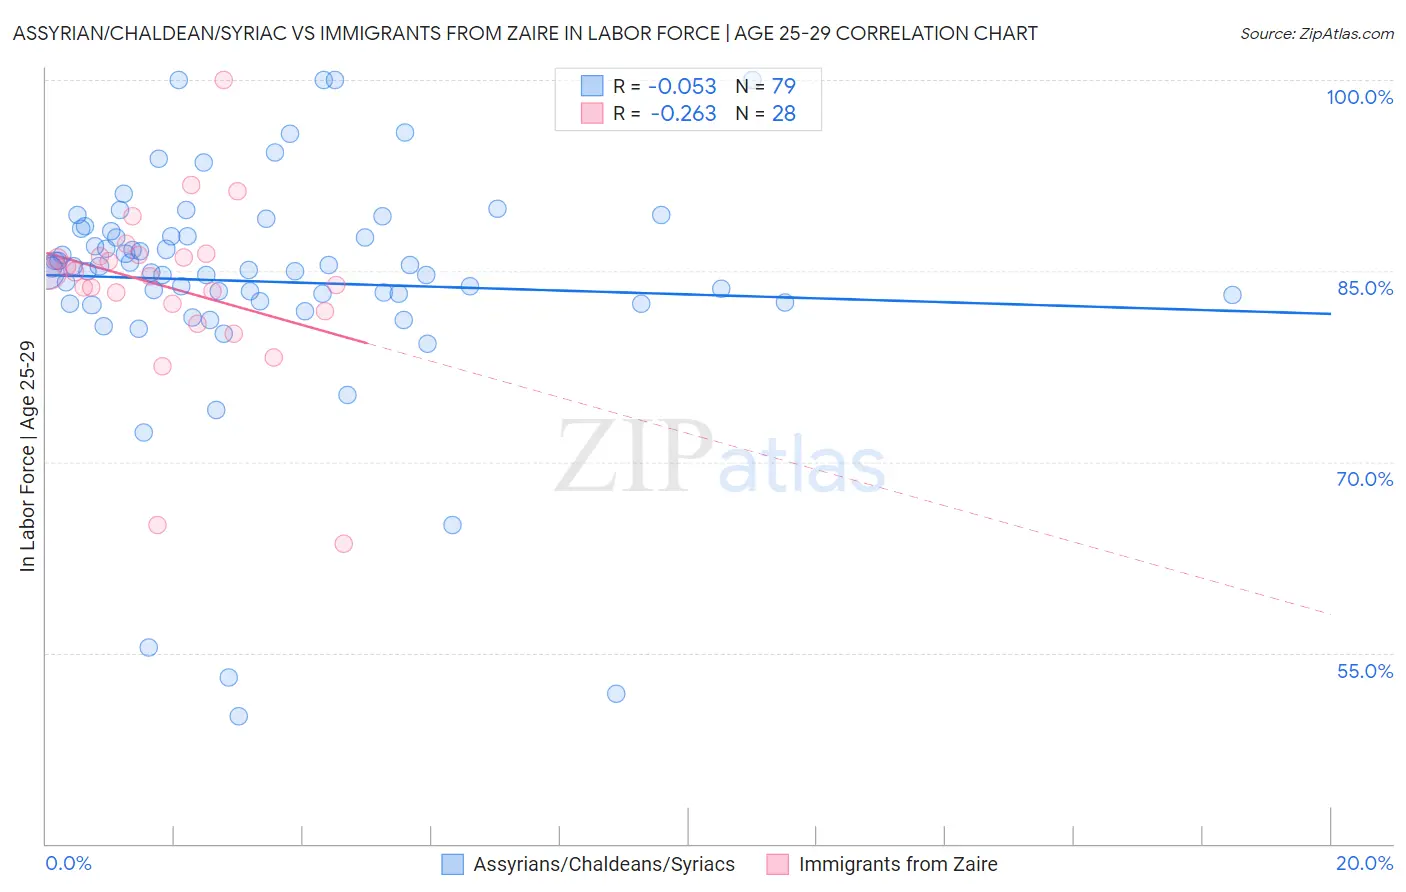
Assyrian/Chaldean/Syriac vs Immigrants from Zaire In Labor Force | Age 25-29 Correlation Chart
The statistical analysis conducted on geographies consisting of 110,302,663 people shows a slight negative correlation between the proportion of Assyrians/Chaldeans/Syriacs and labor force participation rate among population between the ages 25 and 29 in the United States with a correlation coefficient (R) of -0.053 and weighted average of 84.7%. Similarly, the statistical analysis conducted on geographies consisting of 107,250,343 people shows a weak negative correlation between the proportion of Immigrants from Zaire and labor force participation rate among population between the ages 25 and 29 in the United States with a correlation coefficient (R) of -0.263 and weighted average of 85.1%, a difference of 0.48%.
In Labor Force | Age 25-29 Correlation Summary
| Measurement | Assyrian/Chaldean/Syriac | Immigrants from Zaire |
| Minimum | 50.0% | 63.6% |
| Maximum | 100.0% | 100.0% |
| Range | 50.0% | 36.4% |
| Mean | 84.2% | 83.7% |
| Median | 85.1% | 84.8% |
| Interquartile 25% (IQ1) | 82.5% | 82.1% |
| Interquartile 75% (IQ3) | 88.1% | 86.2% |
| Interquartile Range (IQR) | 5.6% | 4.1% |
| Standard Deviation (Sample) | 9.3% | 7.0% |
| Standard Deviation (Population) | 9.3% | 6.9% |
Similar Demographics by In Labor Force | Age 25-29
Demographics Similar to Assyrians/Chaldeans/Syriacs by In Labor Force | Age 25-29
In terms of in labor force | age 25-29, the demographic groups most similar to Assyrians/Chaldeans/Syriacs are Immigrants from Vietnam (84.7%, a difference of 0.0%), Immigrants from Western Europe (84.7%, a difference of 0.0%), Palestinian (84.7%, a difference of 0.0%), Celtic (84.7%, a difference of 0.020%), and Tongan (84.7%, a difference of 0.020%).
| Demographics | Rating | Rank | In Labor Force | Age 25-29 |
| Immigrants | Spain | 56.9 /100 | #166 | Average 84.7% |
| Indonesians | 56.5 /100 | #167 | Average 84.7% |
| South Americans | 54.9 /100 | #168 | Average 84.7% |
| Celtics | 52.5 /100 | #169 | Average 84.7% |
| Tongans | 52.4 /100 | #170 | Average 84.7% |
| Immigrants | Vietnam | 50.5 /100 | #171 | Average 84.7% |
| Immigrants | Western Europe | 50.4 /100 | #172 | Average 84.7% |
| Assyrians/Chaldeans/Syriacs | 50.2 /100 | #173 | Average 84.7% |
| Palestinians | 50.0 /100 | #174 | Average 84.7% |
| Hungarians | 47.8 /100 | #175 | Average 84.6% |
| Malaysians | 46.8 /100 | #176 | Average 84.6% |
| Immigrants | China | 45.7 /100 | #177 | Average 84.6% |
| Immigrants | Thailand | 45.2 /100 | #178 | Average 84.6% |
| Immigrants | Argentina | 44.0 /100 | #179 | Average 84.6% |
| Immigrants | South America | 42.9 /100 | #180 | Average 84.6% |
Demographics Similar to Immigrants from Zaire by In Labor Force | Age 25-29
In terms of in labor force | age 25-29, the demographic groups most similar to Immigrants from Zaire are Egyptian (85.1%, a difference of 0.010%), Slavic (85.1%, a difference of 0.010%), Immigrants from Japan (85.1%, a difference of 0.010%), Immigrants from Hong Kong (85.0%, a difference of 0.010%), and Bangladeshi (85.1%, a difference of 0.020%).
| Demographics | Rating | Rank | In Labor Force | Age 25-29 |
| Immigrants | Sudan | 94.3 /100 | #97 | Exceptional 85.1% |
| Mongolians | 94.1 /100 | #98 | Exceptional 85.1% |
| Bangladeshis | 94.0 /100 | #99 | Exceptional 85.1% |
| Immigrants | Switzerland | 93.9 /100 | #100 | Exceptional 85.1% |
| Egyptians | 93.8 /100 | #101 | Exceptional 85.1% |
| Slavs | 93.7 /100 | #102 | Exceptional 85.1% |
| Immigrants | Japan | 93.5 /100 | #103 | Exceptional 85.1% |
| Immigrants | Zaire | 93.3 /100 | #104 | Exceptional 85.1% |
| Immigrants | Hong Kong | 92.8 /100 | #105 | Exceptional 85.0% |
| Czechoslovakians | 92.6 /100 | #106 | Exceptional 85.0% |
| Immigrants | Southern Europe | 92.3 /100 | #107 | Exceptional 85.0% |
| Immigrants | Austria | 91.9 /100 | #108 | Exceptional 85.0% |
| Costa Ricans | 91.9 /100 | #109 | Exceptional 85.0% |
| New Zealanders | 91.5 /100 | #110 | Exceptional 85.0% |
| Immigrants | Middle Africa | 91.4 /100 | #111 | Exceptional 85.0% |