Northern European vs Immigrants from Zaire Disability Age Over 75
COMPARE
Northern European
Immigrants from Zaire
Disability Age Over 75
Disability Age Over 75 Comparison
Northern Europeans
Immigrants from Zaire
46.3%
DISABILITY AGE OVER 75
98.3/ 100
METRIC RATING
90th/ 347
METRIC RANK
47.1%
DISABILITY AGE OVER 75
74.8/ 100
METRIC RATING
153rd/ 347
METRIC RANK
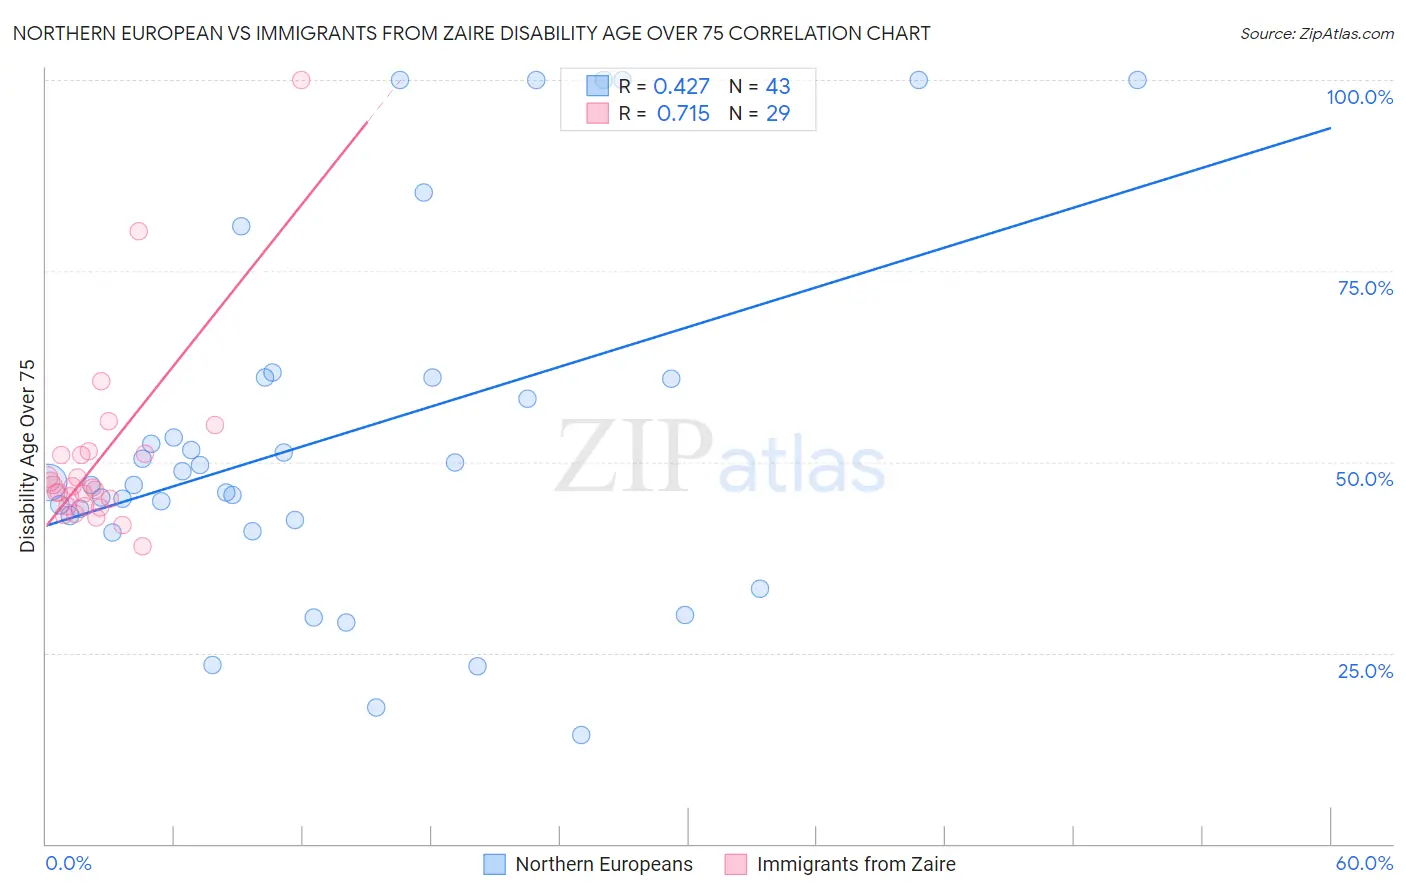
Northern European vs Immigrants from Zaire Disability Age Over 75 Correlation Chart
The statistical analysis conducted on geographies consisting of 405,622,868 people shows a moderate positive correlation between the proportion of Northern Europeans and percentage of population with a disability over the age of 75 in the United States with a correlation coefficient (R) of 0.427 and weighted average of 46.3%. Similarly, the statistical analysis conducted on geographies consisting of 107,207,758 people shows a strong positive correlation between the proportion of Immigrants from Zaire and percentage of population with a disability over the age of 75 in the United States with a correlation coefficient (R) of 0.715 and weighted average of 47.1%, a difference of 1.7%.
Disability Age Over 75 Correlation Summary
| Measurement | Northern European | Immigrants from Zaire |
| Minimum | 14.3% | 39.0% |
| Maximum | 100.0% | 100.0% |
| Range | 85.7% | 61.0% |
| Mean | 53.5% | 50.2% |
| Median | 47.4% | 46.6% |
| Interquartile 25% (IQ1) | 42.4% | 44.2% |
| Interquartile 75% (IQ3) | 61.1% | 51.0% |
| Interquartile Range (IQR) | 18.7% | 6.8% |
| Standard Deviation (Sample) | 23.4% | 12.2% |
| Standard Deviation (Population) | 23.1% | 12.0% |
Similar Demographics by Disability Age Over 75
Demographics Similar to Northern Europeans by Disability Age Over 75
In terms of disability age over 75, the demographic groups most similar to Northern Europeans are Immigrants from Saudi Arabia (46.3%, a difference of 0.010%), Immigrants from Egypt (46.3%, a difference of 0.010%), Uruguayan (46.2%, a difference of 0.020%), German (46.3%, a difference of 0.050%), and Ugandan (46.3%, a difference of 0.060%).
| Demographics | Rating | Rank | Disability Age Over 75 |
| Argentineans | 98.7 /100 | #83 | Exceptional 46.2% |
| Immigrants | Jordan | 98.7 /100 | #84 | Exceptional 46.2% |
| Immigrants | Southern Europe | 98.6 /100 | #85 | Exceptional 46.2% |
| Romanians | 98.6 /100 | #86 | Exceptional 46.2% |
| Danes | 98.6 /100 | #87 | Exceptional 46.2% |
| Uruguayans | 98.4 /100 | #88 | Exceptional 46.2% |
| Immigrants | Saudi Arabia | 98.4 /100 | #89 | Exceptional 46.3% |
| Northern Europeans | 98.3 /100 | #90 | Exceptional 46.3% |
| Immigrants | Egypt | 98.3 /100 | #91 | Exceptional 46.3% |
| Germans | 98.2 /100 | #92 | Exceptional 46.3% |
| Ugandans | 98.2 /100 | #93 | Exceptional 46.3% |
| Albanians | 98.1 /100 | #94 | Exceptional 46.3% |
| Immigrants | Brazil | 98.0 /100 | #95 | Exceptional 46.3% |
| Immigrants | China | 98.0 /100 | #96 | Exceptional 46.3% |
| Finns | 97.9 /100 | #97 | Exceptional 46.3% |
Demographics Similar to Immigrants from Zaire by Disability Age Over 75
In terms of disability age over 75, the demographic groups most similar to Immigrants from Zaire are Immigrants from Belarus (47.1%, a difference of 0.0%), Immigrants from Iran (47.1%, a difference of 0.010%), Arab (47.1%, a difference of 0.040%), Immigrants from Asia (47.0%, a difference of 0.050%), and Bhutanese (47.1%, a difference of 0.070%).
| Demographics | Rating | Rank | Disability Age Over 75 |
| Guyanese | 84.3 /100 | #146 | Excellent 46.9% |
| Immigrants | Peru | 84.1 /100 | #147 | Excellent 46.9% |
| Asians | 81.6 /100 | #148 | Excellent 46.9% |
| Welsh | 81.3 /100 | #149 | Excellent 47.0% |
| Immigrants | Russia | 79.3 /100 | #150 | Good 47.0% |
| French Canadians | 79.0 /100 | #151 | Good 47.0% |
| Immigrants | Asia | 76.5 /100 | #152 | Good 47.0% |
| Immigrants | Zaire | 74.8 /100 | #153 | Good 47.1% |
| Immigrants | Belarus | 74.8 /100 | #154 | Good 47.1% |
| Immigrants | Iran | 74.7 /100 | #155 | Good 47.1% |
| Arabs | 73.3 /100 | #156 | Good 47.1% |
| Bhutanese | 72.6 /100 | #157 | Good 47.1% |
| Immigrants | Guyana | 71.9 /100 | #158 | Good 47.1% |
| Immigrants | Morocco | 71.4 /100 | #159 | Good 47.1% |
| Immigrants | Middle Africa | 68.3 /100 | #160 | Good 47.1% |