Assyrian/Chaldean/Syriac vs Immigrants from Somalia Ambulatory Disability
COMPARE
Assyrian/Chaldean/Syriac
Immigrants from Somalia
Ambulatory Disability
Ambulatory Disability Comparison
Assyrians/Chaldeans/Syriacs
Immigrants from Somalia
6.4%
AMBULATORY DISABILITY
2.4/ 100
METRIC RATING
232nd/ 347
METRIC RANK
5.8%
AMBULATORY DISABILITY
98.3/ 100
METRIC RATING
97th/ 347
METRIC RANK
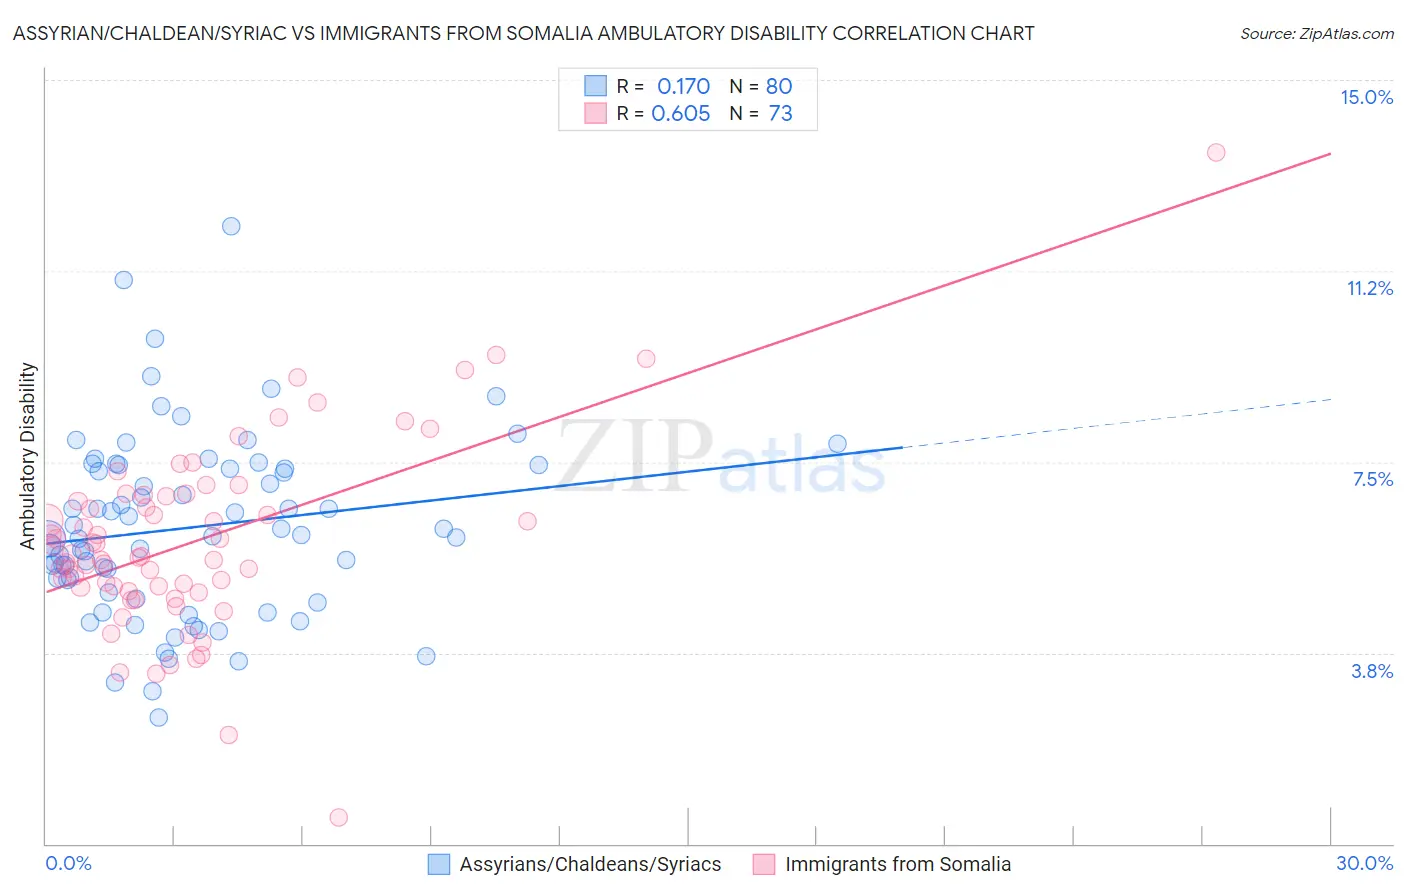
Assyrian/Chaldean/Syriac vs Immigrants from Somalia Ambulatory Disability Correlation Chart
The statistical analysis conducted on geographies consisting of 110,309,207 people shows a poor positive correlation between the proportion of Assyrians/Chaldeans/Syriacs and percentage of population with ambulatory disability in the United States with a correlation coefficient (R) of 0.170 and weighted average of 6.4%. Similarly, the statistical analysis conducted on geographies consisting of 92,104,966 people shows a significant positive correlation between the proportion of Immigrants from Somalia and percentage of population with ambulatory disability in the United States with a correlation coefficient (R) of 0.605 and weighted average of 5.8%, a difference of 10.9%.
Ambulatory Disability Correlation Summary
| Measurement | Assyrian/Chaldean/Syriac | Immigrants from Somalia |
| Minimum | 2.5% | 0.52% |
| Maximum | 12.1% | 13.6% |
| Range | 9.7% | 13.1% |
| Mean | 6.2% | 5.9% |
| Median | 6.1% | 5.7% |
| Interquartile 25% (IQ1) | 5.1% | 5.0% |
| Interquartile 75% (IQ3) | 7.4% | 6.8% |
| Interquartile Range (IQR) | 2.3% | 1.8% |
| Standard Deviation (Sample) | 1.8% | 1.9% |
| Standard Deviation (Population) | 1.8% | 1.9% |
Similar Demographics by Ambulatory Disability
Demographics Similar to Assyrians/Chaldeans/Syriacs by Ambulatory Disability
In terms of ambulatory disability, the demographic groups most similar to Assyrians/Chaldeans/Syriacs are Subsaharan African (6.4%, a difference of 0.060%), Immigrants from Liberia (6.4%, a difference of 0.090%), Hispanic or Latino (6.4%, a difference of 0.12%), Dutch (6.4%, a difference of 0.27%), and Panamanian (6.4%, a difference of 0.33%).
| Demographics | Rating | Rank | Ambulatory Disability |
| Hondurans | 6.3 /100 | #225 | Tragic 6.3% |
| Slavs | 5.1 /100 | #226 | Tragic 6.4% |
| Cubans | 4.0 /100 | #227 | Tragic 6.4% |
| Portuguese | 4.0 /100 | #228 | Tragic 6.4% |
| Czechoslovakians | 3.8 /100 | #229 | Tragic 6.4% |
| Mexicans | 3.5 /100 | #230 | Tragic 6.4% |
| Panamanians | 3.1 /100 | #231 | Tragic 6.4% |
| Assyrians/Chaldeans/Syriacs | 2.4 /100 | #232 | Tragic 6.4% |
| Sub-Saharan Africans | 2.3 /100 | #233 | Tragic 6.4% |
| Immigrants | Liberia | 2.3 /100 | #234 | Tragic 6.4% |
| Hispanics or Latinos | 2.2 /100 | #235 | Tragic 6.4% |
| Dutch | 2.0 /100 | #236 | Tragic 6.4% |
| Immigrants | Germany | 1.8 /100 | #237 | Tragic 6.4% |
| Haitians | 1.8 /100 | #238 | Tragic 6.4% |
| Senegalese | 1.7 /100 | #239 | Tragic 6.4% |
Demographics Similar to Immigrants from Somalia by Ambulatory Disability
In terms of ambulatory disability, the demographic groups most similar to Immigrants from Somalia are Immigrants from Lebanon (5.8%, a difference of 0.020%), Salvadoran (5.8%, a difference of 0.040%), Immigrants from El Salvador (5.8%, a difference of 0.060%), Kenyan (5.8%, a difference of 0.10%), and Immigrants from Northern Europe (5.8%, a difference of 0.11%).
| Demographics | Rating | Rank | Ambulatory Disability |
| Australians | 98.8 /100 | #90 | Exceptional 5.8% |
| Immigrants | Sudan | 98.8 /100 | #91 | Exceptional 5.8% |
| Immigrants | Sierra Leone | 98.6 /100 | #92 | Exceptional 5.8% |
| Immigrants | Denmark | 98.6 /100 | #93 | Exceptional 5.8% |
| Kenyans | 98.4 /100 | #94 | Exceptional 5.8% |
| Immigrants | El Salvador | 98.4 /100 | #95 | Exceptional 5.8% |
| Salvadorans | 98.4 /100 | #96 | Exceptional 5.8% |
| Immigrants | Somalia | 98.3 /100 | #97 | Exceptional 5.8% |
| Immigrants | Lebanon | 98.3 /100 | #98 | Exceptional 5.8% |
| Immigrants | Northern Europe | 98.2 /100 | #99 | Exceptional 5.8% |
| Immigrants | Serbia | 97.9 /100 | #100 | Exceptional 5.8% |
| Immigrants | South America | 97.9 /100 | #101 | Exceptional 5.8% |
| Immigrants | Kenya | 97.8 /100 | #102 | Exceptional 5.8% |
| Immigrants | Romania | 97.7 /100 | #103 | Exceptional 5.8% |
| New Zealanders | 97.6 /100 | #104 | Exceptional 5.8% |