Assyrian/Chaldean/Syriac vs Barbadian Ambulatory Disability
COMPARE
Assyrian/Chaldean/Syriac
Barbadian
Ambulatory Disability
Ambulatory Disability Comparison
Assyrians/Chaldeans/Syriacs
Barbadians
6.4%
AMBULATORY DISABILITY
2.4/ 100
METRIC RATING
232nd/ 347
METRIC RANK
6.8%
AMBULATORY DISABILITY
0.0/ 100
METRIC RATING
282nd/ 347
METRIC RANK
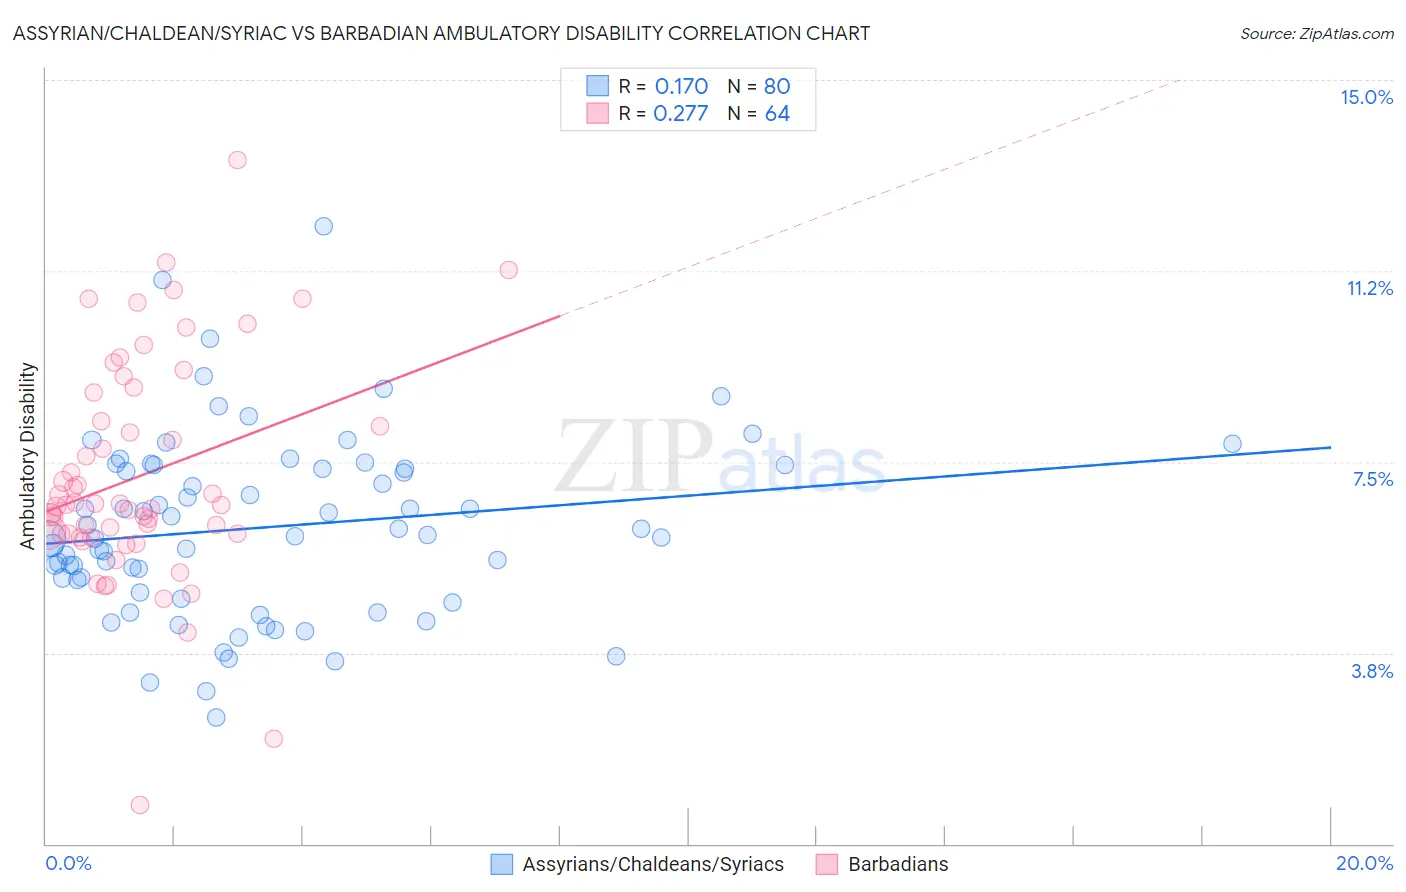
Assyrian/Chaldean/Syriac vs Barbadian Ambulatory Disability Correlation Chart
The statistical analysis conducted on geographies consisting of 110,309,207 people shows a poor positive correlation between the proportion of Assyrians/Chaldeans/Syriacs and percentage of population with ambulatory disability in the United States with a correlation coefficient (R) of 0.170 and weighted average of 6.4%. Similarly, the statistical analysis conducted on geographies consisting of 141,286,079 people shows a weak positive correlation between the proportion of Barbadians and percentage of population with ambulatory disability in the United States with a correlation coefficient (R) of 0.277 and weighted average of 6.8%, a difference of 5.4%.
Ambulatory Disability Correlation Summary
| Measurement | Assyrian/Chaldean/Syriac | Barbadian |
| Minimum | 2.5% | 0.77% |
| Maximum | 12.1% | 13.4% |
| Range | 9.7% | 12.7% |
| Mean | 6.2% | 7.2% |
| Median | 6.1% | 6.7% |
| Interquartile 25% (IQ1) | 5.1% | 6.1% |
| Interquartile 75% (IQ3) | 7.4% | 8.6% |
| Interquartile Range (IQR) | 2.3% | 2.5% |
| Standard Deviation (Sample) | 1.8% | 2.2% |
| Standard Deviation (Population) | 1.8% | 2.2% |
Similar Demographics by Ambulatory Disability
Demographics Similar to Assyrians/Chaldeans/Syriacs by Ambulatory Disability
In terms of ambulatory disability, the demographic groups most similar to Assyrians/Chaldeans/Syriacs are Subsaharan African (6.4%, a difference of 0.060%), Immigrants from Liberia (6.4%, a difference of 0.090%), Hispanic or Latino (6.4%, a difference of 0.12%), Dutch (6.4%, a difference of 0.27%), and Panamanian (6.4%, a difference of 0.33%).
| Demographics | Rating | Rank | Ambulatory Disability |
| Hondurans | 6.3 /100 | #225 | Tragic 6.3% |
| Slavs | 5.1 /100 | #226 | Tragic 6.4% |
| Cubans | 4.0 /100 | #227 | Tragic 6.4% |
| Portuguese | 4.0 /100 | #228 | Tragic 6.4% |
| Czechoslovakians | 3.8 /100 | #229 | Tragic 6.4% |
| Mexicans | 3.5 /100 | #230 | Tragic 6.4% |
| Panamanians | 3.1 /100 | #231 | Tragic 6.4% |
| Assyrians/Chaldeans/Syriacs | 2.4 /100 | #232 | Tragic 6.4% |
| Sub-Saharan Africans | 2.3 /100 | #233 | Tragic 6.4% |
| Immigrants | Liberia | 2.3 /100 | #234 | Tragic 6.4% |
| Hispanics or Latinos | 2.2 /100 | #235 | Tragic 6.4% |
| Dutch | 2.0 /100 | #236 | Tragic 6.4% |
| Immigrants | Germany | 1.8 /100 | #237 | Tragic 6.4% |
| Haitians | 1.8 /100 | #238 | Tragic 6.4% |
| Senegalese | 1.7 /100 | #239 | Tragic 6.4% |
Demographics Similar to Barbadians by Ambulatory Disability
In terms of ambulatory disability, the demographic groups most similar to Barbadians are Yaqui (6.8%, a difference of 0.13%), Immigrants from Barbados (6.8%, a difference of 0.16%), Pennsylvania German (6.8%, a difference of 0.20%), Immigrants from Jamaica (6.8%, a difference of 0.23%), and Immigrants from Caribbean (6.7%, a difference of 0.30%).
| Demographics | Rating | Rank | Ambulatory Disability |
| Immigrants | Guyana | 0.1 /100 | #275 | Tragic 6.7% |
| Celtics | 0.1 /100 | #276 | Tragic 6.7% |
| Jamaicans | 0.1 /100 | #277 | Tragic 6.7% |
| Immigrants | West Indies | 0.1 /100 | #278 | Tragic 6.7% |
| Immigrants | Caribbean | 0.0 /100 | #279 | Tragic 6.7% |
| Pennsylvania Germans | 0.0 /100 | #280 | Tragic 6.8% |
| Yaqui | 0.0 /100 | #281 | Tragic 6.8% |
| Barbadians | 0.0 /100 | #282 | Tragic 6.8% |
| Immigrants | Barbados | 0.0 /100 | #283 | Tragic 6.8% |
| Immigrants | Jamaica | 0.0 /100 | #284 | Tragic 6.8% |
| Fijians | 0.0 /100 | #285 | Tragic 6.8% |
| Yakama | 0.0 /100 | #286 | Tragic 6.8% |
| U.S. Virgin Islanders | 0.0 /100 | #287 | Tragic 6.8% |
| Immigrants | Nonimmigrants | 0.0 /100 | #288 | Tragic 6.9% |
| Immigrants | Dominica | 0.0 /100 | #289 | Tragic 6.9% |