Assyrian/Chaldean/Syriac vs Immigrants In Labor Force | Age 45-54
COMPARE
Assyrian/Chaldean/Syriac
Immigrants
In Labor Force | Age 45-54
In Labor Force | Age 45-54 Comparison
Assyrians/Chaldeans/Syriacs
Immigrants
83.2%
IN LABOR FORCE | AGE 45-54
91.7/ 100
METRIC RATING
114th/ 347
METRIC RANK
82.1%
IN LABOR FORCE | AGE 45-54
3.1/ 100
METRIC RATING
223rd/ 347
METRIC RANK
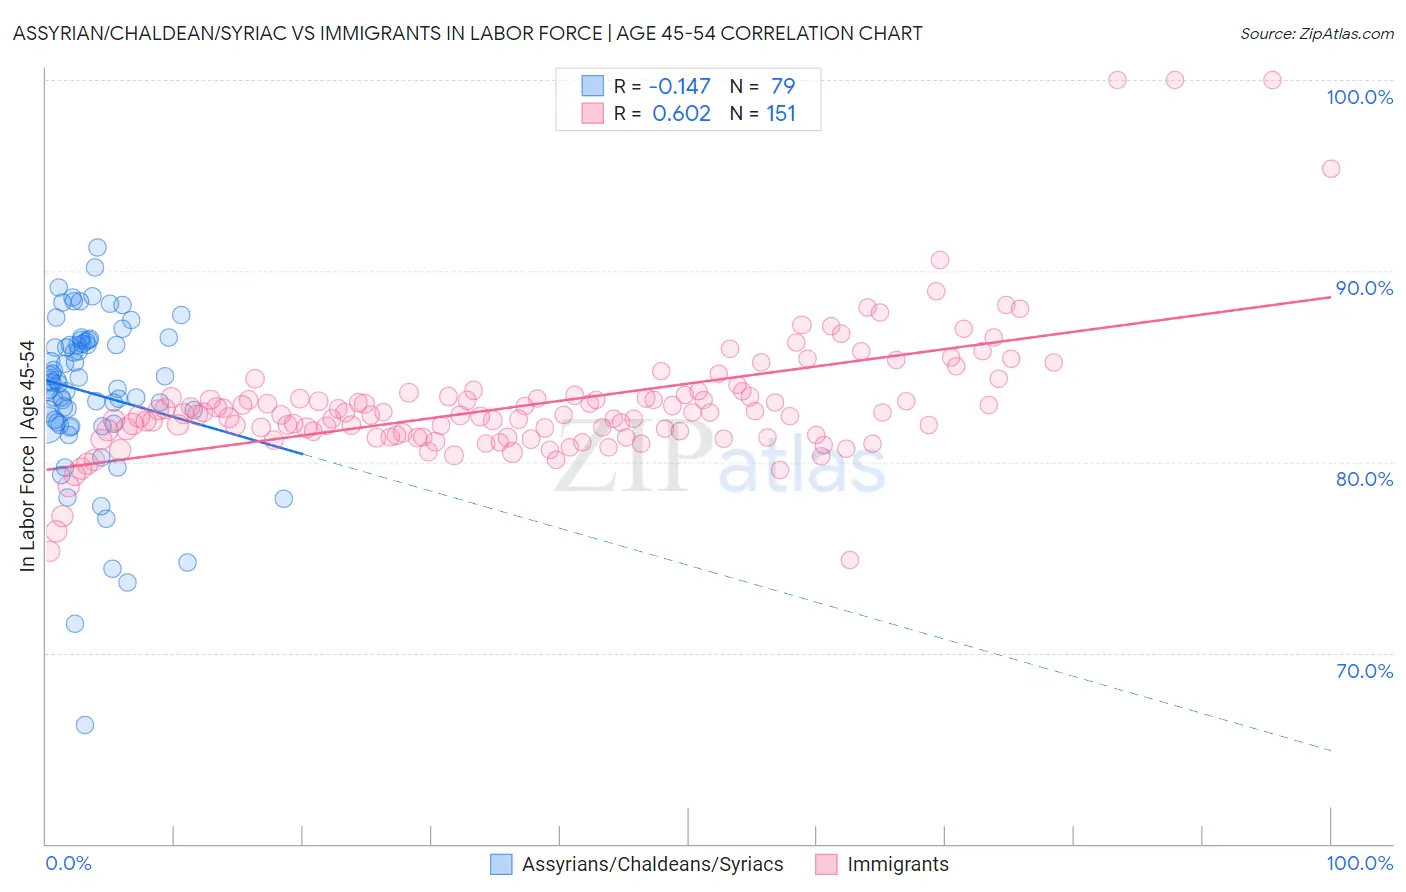
Assyrian/Chaldean/Syriac vs Immigrants In Labor Force | Age 45-54 Correlation Chart
The statistical analysis conducted on geographies consisting of 110,290,950 people shows a poor negative correlation between the proportion of Assyrians/Chaldeans/Syriacs and labor force participation rate among population between the ages 45 and 54 in the United States with a correlation coefficient (R) of -0.147 and weighted average of 83.2%. Similarly, the statistical analysis conducted on geographies consisting of 576,883,535 people shows a significant positive correlation between the proportion of Immigrants and labor force participation rate among population between the ages 45 and 54 in the United States with a correlation coefficient (R) of 0.602 and weighted average of 82.1%, a difference of 1.3%.
In Labor Force | Age 45-54 Correlation Summary
| Measurement | Assyrian/Chaldean/Syriac | Immigrants |
| Minimum | 66.2% | 74.9% |
| Maximum | 91.2% | 100.0% |
| Range | 25.0% | 25.1% |
| Mean | 83.6% | 83.1% |
| Median | 84.2% | 82.5% |
| Interquartile 25% (IQ1) | 82.0% | 81.3% |
| Interquartile 75% (IQ3) | 86.3% | 83.4% |
| Interquartile Range (IQR) | 4.3% | 2.1% |
| Standard Deviation (Sample) | 4.2% | 3.5% |
| Standard Deviation (Population) | 4.2% | 3.5% |
Similar Demographics by In Labor Force | Age 45-54
Demographics Similar to Assyrians/Chaldeans/Syriacs by In Labor Force | Age 45-54
In terms of in labor force | age 45-54, the demographic groups most similar to Assyrians/Chaldeans/Syriacs are Immigrants from Albania (83.2%, a difference of 0.0%), Immigrants from Chile (83.2%, a difference of 0.0%), Immigrants from Malaysia (83.2%, a difference of 0.010%), Immigrants from Italy (83.2%, a difference of 0.020%), and Immigrants from Afghanistan (83.2%, a difference of 0.020%).
| Demographics | Rating | Rank | In Labor Force | Age 45-54 |
| Iranians | 92.9 /100 | #107 | Exceptional 83.2% |
| Slovaks | 92.8 /100 | #108 | Exceptional 83.2% |
| Ukrainians | 92.7 /100 | #109 | Exceptional 83.2% |
| Immigrants | Africa | 92.6 /100 | #110 | Exceptional 83.2% |
| Immigrants | Italy | 92.5 /100 | #111 | Exceptional 83.2% |
| Immigrants | Afghanistan | 92.4 /100 | #112 | Exceptional 83.2% |
| Immigrants | Albania | 91.8 /100 | #113 | Exceptional 83.2% |
| Assyrians/Chaldeans/Syriacs | 91.7 /100 | #114 | Exceptional 83.2% |
| Immigrants | Chile | 91.6 /100 | #115 | Exceptional 83.2% |
| Immigrants | Malaysia | 91.4 /100 | #116 | Exceptional 83.2% |
| Immigrants | China | 90.9 /100 | #117 | Exceptional 83.2% |
| Immigrants | Europe | 90.7 /100 | #118 | Exceptional 83.2% |
| Immigrants | Uruguay | 90.2 /100 | #119 | Exceptional 83.2% |
| Immigrants | Russia | 90.1 /100 | #120 | Exceptional 83.2% |
| Uruguayans | 89.4 /100 | #121 | Excellent 83.1% |
Demographics Similar to Immigrants by In Labor Force | Age 45-54
In terms of in labor force | age 45-54, the demographic groups most similar to Immigrants are Panamanian (82.2%, a difference of 0.020%), Immigrants from Ecuador (82.2%, a difference of 0.020%), Bahamian (82.2%, a difference of 0.030%), Immigrants from Jamaica (82.1%, a difference of 0.030%), and Immigrants from Oceania (82.1%, a difference of 0.050%).
| Demographics | Rating | Rank | In Labor Force | Age 45-54 |
| Scottish | 5.3 /100 | #216 | Tragic 82.2% |
| Portuguese | 4.7 /100 | #217 | Tragic 82.2% |
| English | 4.4 /100 | #218 | Tragic 82.2% |
| French | 4.1 /100 | #219 | Tragic 82.2% |
| Bahamians | 3.6 /100 | #220 | Tragic 82.2% |
| Panamanians | 3.5 /100 | #221 | Tragic 82.2% |
| Immigrants | Ecuador | 3.4 /100 | #222 | Tragic 82.2% |
| Immigrants | Immigrants | 3.1 /100 | #223 | Tragic 82.1% |
| Immigrants | Jamaica | 2.7 /100 | #224 | Tragic 82.1% |
| Immigrants | Oceania | 2.5 /100 | #225 | Tragic 82.1% |
| Immigrants | Caribbean | 2.5 /100 | #226 | Tragic 82.1% |
| Immigrants | Germany | 2.4 /100 | #227 | Tragic 82.1% |
| Cape Verdeans | 2.1 /100 | #228 | Tragic 82.1% |
| Immigrants | Burma/Myanmar | 1.9 /100 | #229 | Tragic 82.0% |
| Jamaicans | 1.8 /100 | #230 | Tragic 82.0% |