Cherokee vs Creek Disability Age Over 75
COMPARE
Cherokee
Creek
Disability Age Over 75
Disability Age Over 75 Comparison
Cherokee
Creek
50.2%
DISABILITY AGE OVER 75
0.0/ 100
METRIC RATING
302nd/ 347
METRIC RANK
51.5%
DISABILITY AGE OVER 75
0.0/ 100
METRIC RATING
319th/ 347
METRIC RANK
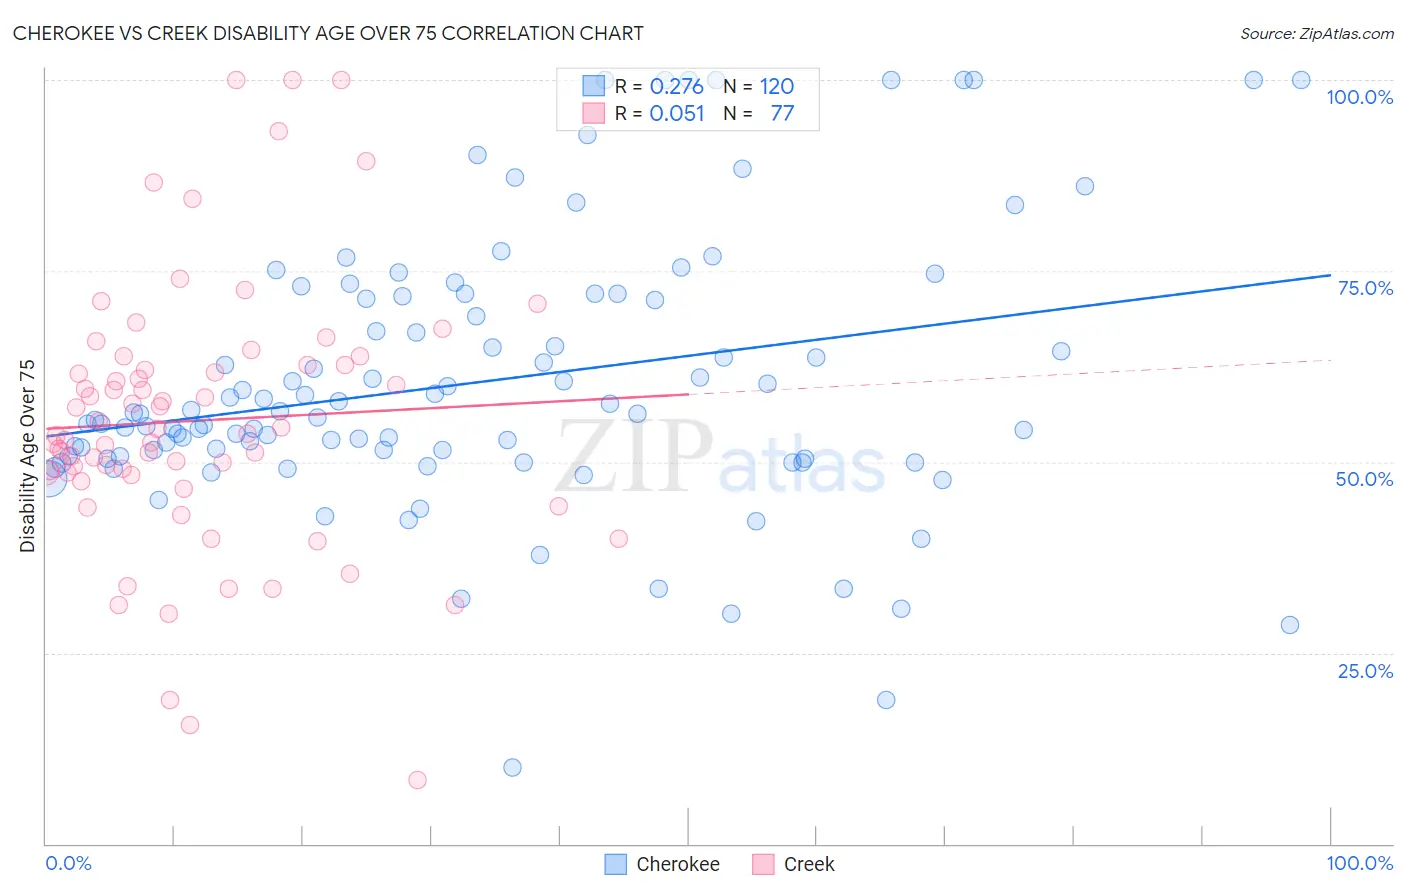
Cherokee vs Creek Disability Age Over 75 Correlation Chart
The statistical analysis conducted on geographies consisting of 492,575,562 people shows a weak positive correlation between the proportion of Cherokee and percentage of population with a disability over the age of 75 in the United States with a correlation coefficient (R) of 0.276 and weighted average of 50.2%. Similarly, the statistical analysis conducted on geographies consisting of 178,338,253 people shows a slight positive correlation between the proportion of Creek and percentage of population with a disability over the age of 75 in the United States with a correlation coefficient (R) of 0.051 and weighted average of 51.5%, a difference of 2.4%.
Disability Age Over 75 Correlation Summary
| Measurement | Cherokee | Creek |
| Minimum | 10.0% | 8.3% |
| Maximum | 100.0% | 100.0% |
| Range | 90.0% | 91.7% |
| Mean | 60.5% | 55.4% |
| Median | 56.3% | 53.7% |
| Interquartile 25% (IQ1) | 50.6% | 48.5% |
| Interquartile 75% (IQ3) | 71.5% | 62.7% |
| Interquartile Range (IQR) | 20.9% | 14.2% |
| Standard Deviation (Sample) | 17.8% | 17.5% |
| Standard Deviation (Population) | 17.7% | 17.4% |
Demographics Similar to Cherokee and Creek by Disability Age Over 75
In terms of disability age over 75, the demographic groups most similar to Cherokee are Japanese (50.2%, a difference of 0.010%), Immigrants from Dominican Republic (50.3%, a difference of 0.12%), Dominican (50.2%, a difference of 0.15%), Cape Verdean (50.1%, a difference of 0.21%), and Central American Indian (50.5%, a difference of 0.53%). Similarly, the demographic groups most similar to Creek are Seminole (51.5%, a difference of 0.0%), Paiute (51.5%, a difference of 0.14%), Yakama (51.3%, a difference of 0.33%), Chickasaw (51.2%, a difference of 0.51%), and Mexican (51.1%, a difference of 0.65%).
| Demographics | Rating | Rank | Disability Age Over 75 |
| Cape Verdeans | 0.0 /100 | #300 | Tragic 50.1% |
| Dominicans | 0.0 /100 | #301 | Tragic 50.2% |
| Cherokee | 0.0 /100 | #302 | Tragic 50.2% |
| Japanese | 0.0 /100 | #303 | Tragic 50.2% |
| Immigrants | Dominican Republic | 0.0 /100 | #304 | Tragic 50.3% |
| Central American Indians | 0.0 /100 | #305 | Tragic 50.5% |
| Immigrants | Central America | 0.0 /100 | #306 | Tragic 50.5% |
| Immigrants | Fiji | 0.0 /100 | #307 | Tragic 50.6% |
| Hispanics or Latinos | 0.0 /100 | #308 | Tragic 50.6% |
| Aleuts | 0.0 /100 | #309 | Tragic 50.6% |
| Tlingit-Haida | 0.0 /100 | #310 | Tragic 50.6% |
| Cajuns | 0.0 /100 | #311 | Tragic 50.7% |
| Cheyenne | 0.0 /100 | #312 | Tragic 50.9% |
| Immigrants | Azores | 0.0 /100 | #313 | Tragic 50.9% |
| Immigrants | Mexico | 0.0 /100 | #314 | Tragic 51.1% |
| Mexicans | 0.0 /100 | #315 | Tragic 51.1% |
| Chickasaw | 0.0 /100 | #316 | Tragic 51.2% |
| Yakama | 0.0 /100 | #317 | Tragic 51.3% |
| Seminole | 0.0 /100 | #318 | Tragic 51.5% |
| Creek | 0.0 /100 | #319 | Tragic 51.5% |
| Paiute | 0.0 /100 | #320 | Tragic 51.5% |