Hispanic or Latino vs Creek Disability Age Over 75
COMPARE
Hispanic or Latino
Creek
Disability Age Over 75
Disability Age Over 75 Comparison
Hispanics or Latinos
Creek
50.6%
DISABILITY AGE OVER 75
0.0/ 100
METRIC RATING
308th/ 347
METRIC RANK
51.5%
DISABILITY AGE OVER 75
0.0/ 100
METRIC RATING
319th/ 347
METRIC RANK
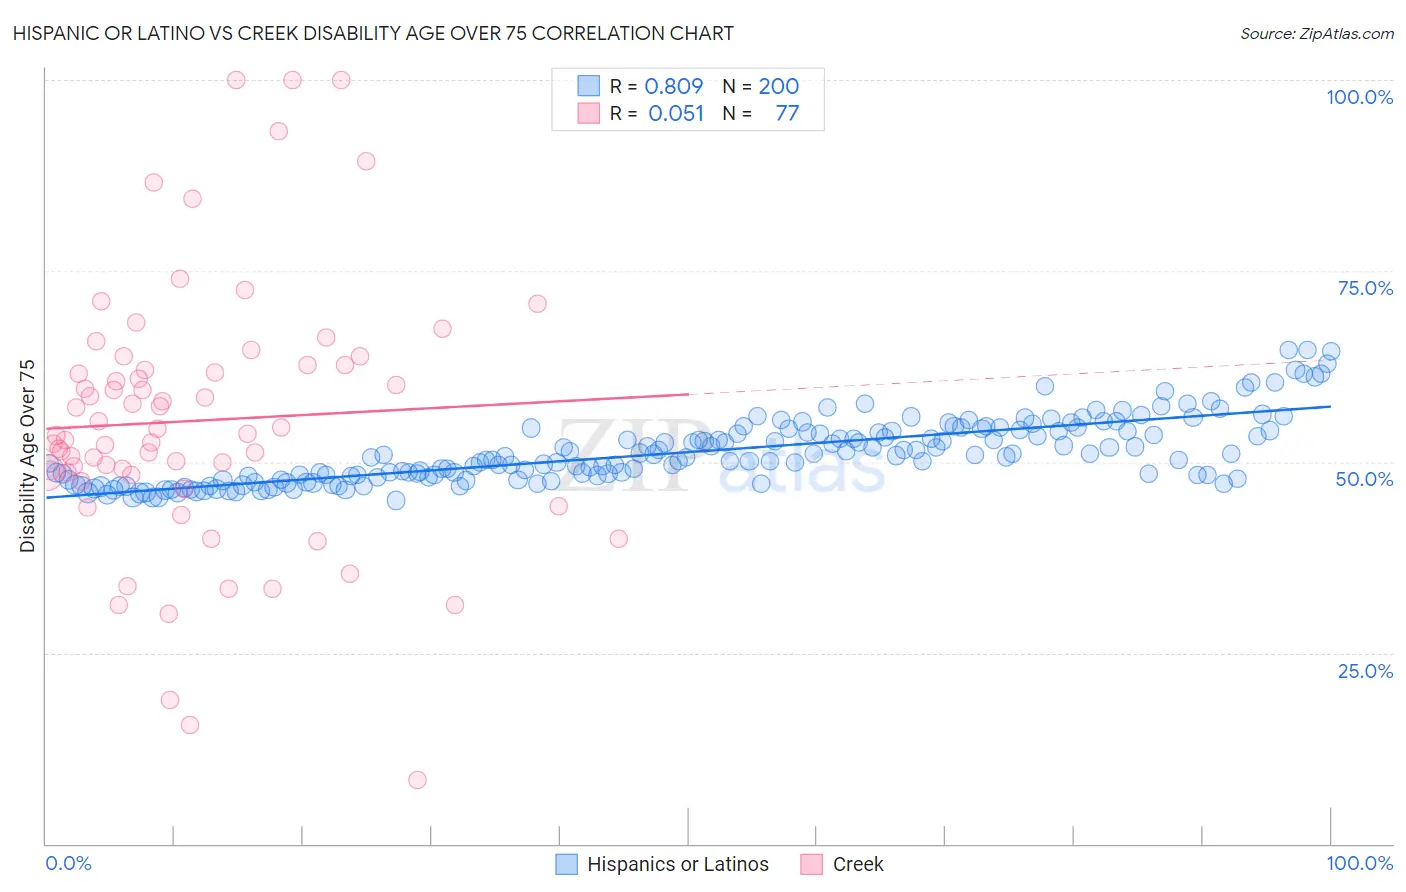
Hispanic or Latino vs Creek Disability Age Over 75 Correlation Chart
The statistical analysis conducted on geographies consisting of 575,638,204 people shows a very strong positive correlation between the proportion of Hispanics or Latinos and percentage of population with a disability over the age of 75 in the United States with a correlation coefficient (R) of 0.809 and weighted average of 50.6%. Similarly, the statistical analysis conducted on geographies consisting of 178,338,253 people shows a slight positive correlation between the proportion of Creek and percentage of population with a disability over the age of 75 in the United States with a correlation coefficient (R) of 0.051 and weighted average of 51.5%, a difference of 1.7%.
Disability Age Over 75 Correlation Summary
| Measurement | Hispanic or Latino | Creek |
| Minimum | 45.0% | 8.3% |
| Maximum | 64.7% | 100.0% |
| Range | 19.8% | 91.7% |
| Mean | 51.3% | 55.4% |
| Median | 50.5% | 53.7% |
| Interquartile 25% (IQ1) | 47.9% | 48.5% |
| Interquartile 75% (IQ3) | 54.0% | 62.7% |
| Interquartile Range (IQR) | 6.1% | 14.2% |
| Standard Deviation (Sample) | 4.3% | 17.5% |
| Standard Deviation (Population) | 4.3% | 17.4% |
Demographics Similar to Hispanics or Latinos and Creek by Disability Age Over 75
In terms of disability age over 75, the demographic groups most similar to Hispanics or Latinos are Aleut (50.6%, a difference of 0.0%), Immigrants from Fiji (50.6%, a difference of 0.020%), Tlingit-Haida (50.6%, a difference of 0.040%), Immigrants from Central America (50.5%, a difference of 0.080%), and Cajun (50.7%, a difference of 0.14%). Similarly, the demographic groups most similar to Creek are Seminole (51.5%, a difference of 0.0%), Paiute (51.5%, a difference of 0.14%), Dutch West Indian (51.5%, a difference of 0.15%), Yakama (51.3%, a difference of 0.33%), and Comanche (51.7%, a difference of 0.48%).
| Demographics | Rating | Rank | Disability Age Over 75 |
| Japanese | 0.0 /100 | #303 | Tragic 50.2% |
| Immigrants | Dominican Republic | 0.0 /100 | #304 | Tragic 50.3% |
| Central American Indians | 0.0 /100 | #305 | Tragic 50.5% |
| Immigrants | Central America | 0.0 /100 | #306 | Tragic 50.5% |
| Immigrants | Fiji | 0.0 /100 | #307 | Tragic 50.6% |
| Hispanics or Latinos | 0.0 /100 | #308 | Tragic 50.6% |
| Aleuts | 0.0 /100 | #309 | Tragic 50.6% |
| Tlingit-Haida | 0.0 /100 | #310 | Tragic 50.6% |
| Cajuns | 0.0 /100 | #311 | Tragic 50.7% |
| Cheyenne | 0.0 /100 | #312 | Tragic 50.9% |
| Immigrants | Azores | 0.0 /100 | #313 | Tragic 50.9% |
| Immigrants | Mexico | 0.0 /100 | #314 | Tragic 51.1% |
| Mexicans | 0.0 /100 | #315 | Tragic 51.1% |
| Chickasaw | 0.0 /100 | #316 | Tragic 51.2% |
| Yakama | 0.0 /100 | #317 | Tragic 51.3% |
| Seminole | 0.0 /100 | #318 | Tragic 51.5% |
| Creek | 0.0 /100 | #319 | Tragic 51.5% |
| Paiute | 0.0 /100 | #320 | Tragic 51.5% |
| Dutch West Indians | 0.0 /100 | #321 | Tragic 51.5% |
| Comanche | 0.0 /100 | #322 | Tragic 51.7% |
| Immigrants | Yemen | 0.0 /100 | #323 | Tragic 52.0% |