Armenian vs Immigrants from Somalia 9th Grade
COMPARE
Armenian
Immigrants from Somalia
9th Grade
9th Grade Comparison
Armenians
Immigrants from Somalia
93.9%
9TH GRADE
0.3/ 100
METRIC RATING
267th/ 347
METRIC RANK
94.1%
9TH GRADE
1.4/ 100
METRIC RATING
248th/ 347
METRIC RANK
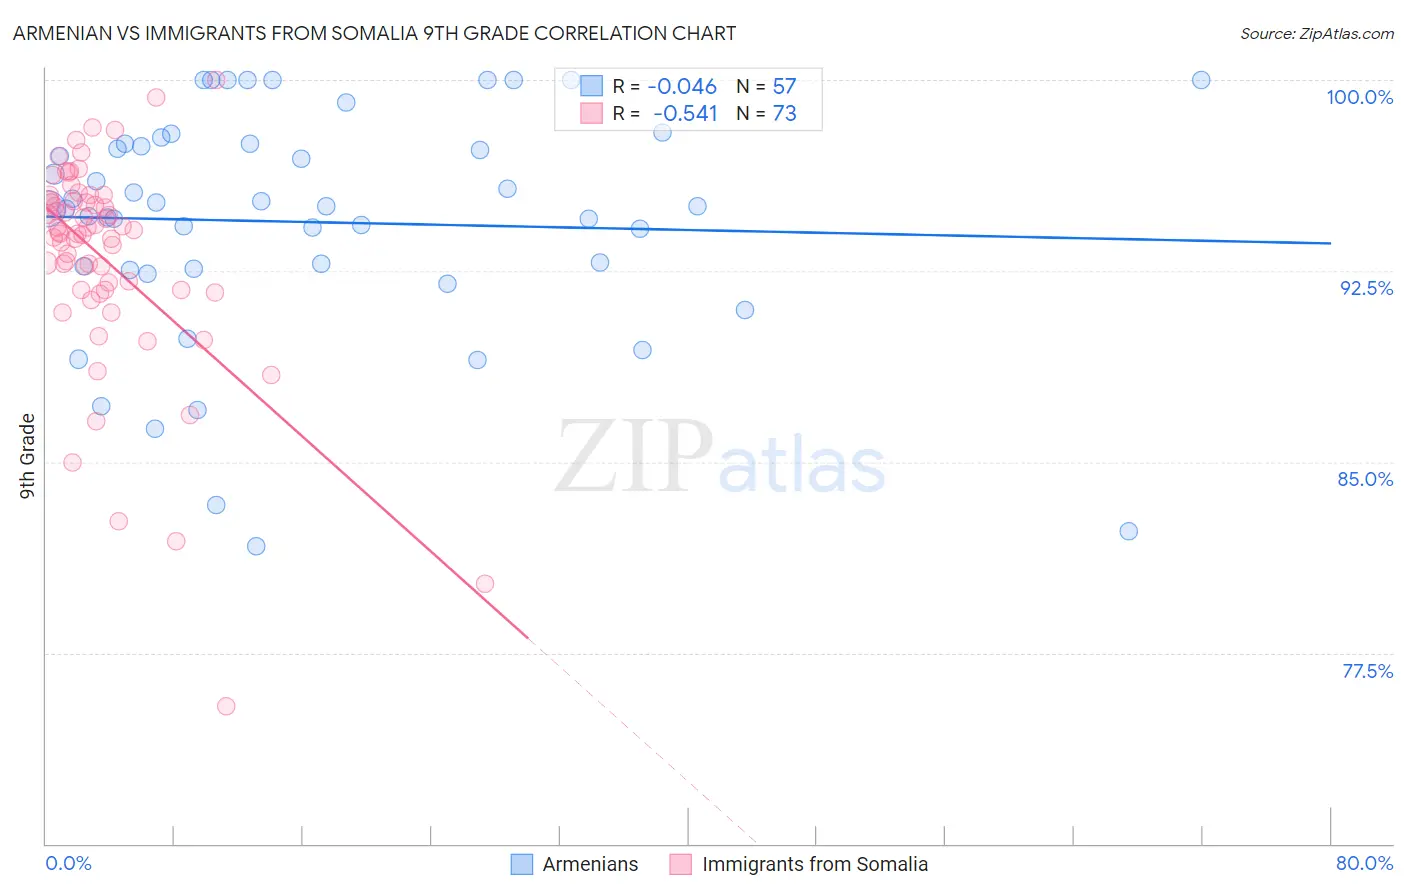
Armenian vs Immigrants from Somalia 9th Grade Correlation Chart
The statistical analysis conducted on geographies consisting of 310,954,801 people shows no correlation between the proportion of Armenians and percentage of population with at least 9th grade education in the United States with a correlation coefficient (R) of -0.046 and weighted average of 93.9%. Similarly, the statistical analysis conducted on geographies consisting of 92,097,499 people shows a substantial negative correlation between the proportion of Immigrants from Somalia and percentage of population with at least 9th grade education in the United States with a correlation coefficient (R) of -0.541 and weighted average of 94.1%, a difference of 0.28%.
9th Grade Correlation Summary
| Measurement | Armenian | Immigrants from Somalia |
| Minimum | 81.7% | 75.4% |
| Maximum | 100.0% | 100.0% |
| Range | 18.3% | 24.6% |
| Mean | 94.4% | 93.0% |
| Median | 95.0% | 94.0% |
| Interquartile 25% (IQ1) | 92.6% | 91.7% |
| Interquartile 75% (IQ3) | 97.5% | 95.3% |
| Interquartile Range (IQR) | 4.9% | 3.5% |
| Standard Deviation (Sample) | 4.5% | 4.2% |
| Standard Deviation (Population) | 4.5% | 4.2% |
Demographics Similar to Armenians and Immigrants from Somalia by 9th Grade
In terms of 9th grade, the demographic groups most similar to Armenians are Navajo (93.9%, a difference of 0.020%), Immigrants from Uzbekistan (93.9%, a difference of 0.030%), Immigrants from Congo (93.9%, a difference of 0.030%), Native/Alaskan (93.9%, a difference of 0.030%), and Immigrants from Jamaica (93.9%, a difference of 0.040%). Similarly, the demographic groups most similar to Immigrants from Somalia are Uruguayan (94.1%, a difference of 0.010%), Immigrants from Hong Kong (94.1%, a difference of 0.010%), Afghan (94.2%, a difference of 0.050%), Jamaican (94.1%, a difference of 0.070%), and Immigrants from Senegal (94.1%, a difference of 0.080%).
| Demographics | Rating | Rank | 9th Grade |
| Afghans | 1.8 /100 | #247 | Tragic 94.2% |
| Immigrants | Somalia | 1.4 /100 | #248 | Tragic 94.1% |
| Uruguayans | 1.3 /100 | #249 | Tragic 94.1% |
| Immigrants | Hong Kong | 1.3 /100 | #250 | Tragic 94.1% |
| Jamaicans | 1.0 /100 | #251 | Tragic 94.1% |
| Immigrants | Senegal | 0.9 /100 | #252 | Tragic 94.1% |
| Colombians | 0.8 /100 | #253 | Tragic 94.0% |
| U.S. Virgin Islanders | 0.7 /100 | #254 | Tragic 94.0% |
| Immigrants | Nigeria | 0.6 /100 | #255 | Tragic 94.0% |
| Immigrants | Afghanistan | 0.5 /100 | #256 | Tragic 94.0% |
| Immigrants | Costa Rica | 0.5 /100 | #257 | Tragic 94.0% |
| Immigrants | Thailand | 0.5 /100 | #258 | Tragic 93.9% |
| Ghanaians | 0.5 /100 | #259 | Tragic 93.9% |
| Pima | 0.4 /100 | #260 | Tragic 93.9% |
| South Americans | 0.4 /100 | #261 | Tragic 93.9% |
| Immigrants | Jamaica | 0.4 /100 | #262 | Tragic 93.9% |
| Immigrants | Uzbekistan | 0.4 /100 | #263 | Tragic 93.9% |
| Immigrants | Congo | 0.4 /100 | #264 | Tragic 93.9% |
| Natives/Alaskans | 0.4 /100 | #265 | Tragic 93.9% |
| Navajo | 0.3 /100 | #266 | Tragic 93.9% |
| Armenians | 0.3 /100 | #267 | Tragic 93.9% |