Immigrants from Caribbean vs Immigrants from Israel Self-Care Disability
COMPARE
Immigrants from Caribbean
Immigrants from Israel
Self-Care Disability
Self-Care Disability Comparison
Immigrants from Caribbean
Immigrants from Israel
2.8%
SELF-CARE DISABILITY
0.0/ 100
METRIC RATING
312th/ 347
METRIC RANK
2.4%
SELF-CARE DISABILITY
96.1/ 100
METRIC RATING
99th/ 347
METRIC RANK
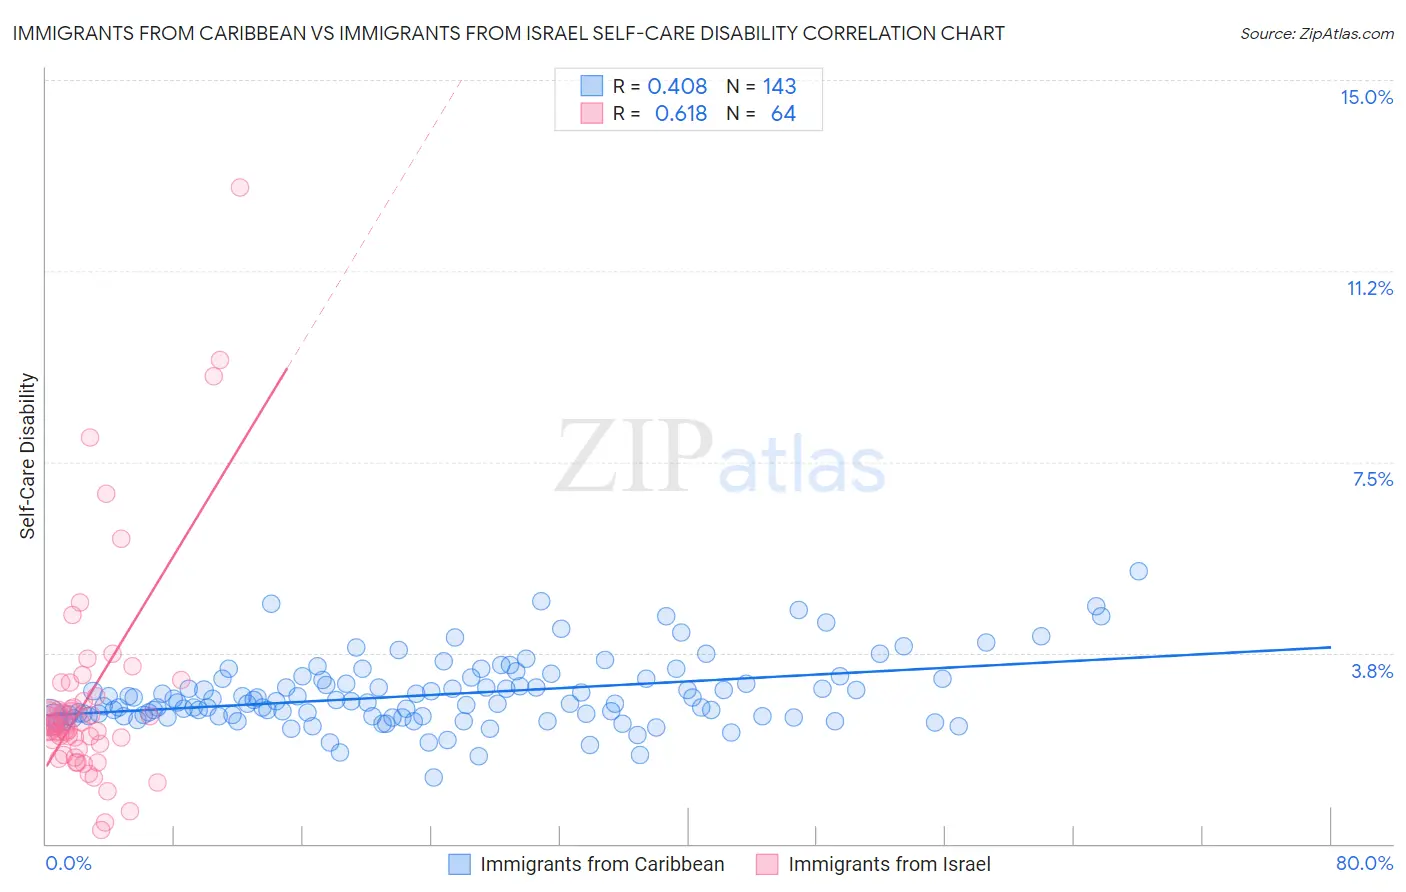
Immigrants from Caribbean vs Immigrants from Israel Self-Care Disability Correlation Chart
The statistical analysis conducted on geographies consisting of 449,223,668 people shows a moderate positive correlation between the proportion of Immigrants from Caribbean and percentage of population with self-care disability in the United States with a correlation coefficient (R) of 0.408 and weighted average of 2.8%. Similarly, the statistical analysis conducted on geographies consisting of 209,935,200 people shows a significant positive correlation between the proportion of Immigrants from Israel and percentage of population with self-care disability in the United States with a correlation coefficient (R) of 0.618 and weighted average of 2.4%, a difference of 19.2%.
Self-Care Disability Correlation Summary
| Measurement | Immigrants from Caribbean | Immigrants from Israel |
| Minimum | 1.3% | 0.28% |
| Maximum | 5.4% | 12.9% |
| Range | 4.1% | 12.6% |
| Mean | 2.9% | 2.9% |
| Median | 2.8% | 2.3% |
| Interquartile 25% (IQ1) | 2.5% | 2.0% |
| Interquartile 75% (IQ3) | 3.2% | 2.8% |
| Interquartile Range (IQR) | 0.74% | 0.83% |
| Standard Deviation (Sample) | 0.67% | 2.2% |
| Standard Deviation (Population) | 0.66% | 2.1% |
Similar Demographics by Self-Care Disability
Demographics Similar to Immigrants from Caribbean by Self-Care Disability
In terms of self-care disability, the demographic groups most similar to Immigrants from Caribbean are Spanish American (2.8%, a difference of 0.030%), Puget Sound Salish (2.8%, a difference of 0.19%), Creek (2.8%, a difference of 0.25%), British West Indian (2.8%, a difference of 0.26%), and Bangladeshi (2.8%, a difference of 0.36%).
| Demographics | Rating | Rank | Self-Care Disability |
| Immigrants | West Indies | 0.0 /100 | #305 | Tragic 2.8% |
| Aleuts | 0.0 /100 | #306 | Tragic 2.8% |
| Natives/Alaskans | 0.0 /100 | #307 | Tragic 2.8% |
| Immigrants | Grenada | 0.0 /100 | #308 | Tragic 2.8% |
| Bangladeshis | 0.0 /100 | #309 | Tragic 2.8% |
| British West Indians | 0.0 /100 | #310 | Tragic 2.8% |
| Puget Sound Salish | 0.0 /100 | #311 | Tragic 2.8% |
| Immigrants | Caribbean | 0.0 /100 | #312 | Tragic 2.8% |
| Spanish Americans | 0.0 /100 | #313 | Tragic 2.8% |
| Creek | 0.0 /100 | #314 | Tragic 2.8% |
| Immigrants | Cuba | 0.0 /100 | #315 | Tragic 2.8% |
| Menominee | 0.0 /100 | #316 | Tragic 2.8% |
| Immigrants | Dominica | 0.0 /100 | #317 | Tragic 2.8% |
| Assyrians/Chaldeans/Syriacs | 0.0 /100 | #318 | Tragic 2.8% |
| Spanish American Indians | 0.0 /100 | #319 | Tragic 2.9% |
Demographics Similar to Immigrants from Israel by Self-Care Disability
In terms of self-care disability, the demographic groups most similar to Immigrants from Israel are Immigrants from Poland (2.4%, a difference of 0.080%), European (2.4%, a difference of 0.10%), Immigrants from Scotland (2.4%, a difference of 0.15%), Swiss (2.4%, a difference of 0.17%), and Immigrants from Chile (2.4%, a difference of 0.21%).
| Demographics | Rating | Rank | Self-Care Disability |
| Icelanders | 97.4 /100 | #92 | Exceptional 2.4% |
| Immigrants | Latvia | 97.0 /100 | #93 | Exceptional 2.4% |
| Macedonians | 96.9 /100 | #94 | Exceptional 2.4% |
| Immigrants | Asia | 96.9 /100 | #95 | Exceptional 2.4% |
| Immigrants | Chile | 96.7 /100 | #96 | Exceptional 2.4% |
| Swiss | 96.6 /100 | #97 | Exceptional 2.4% |
| Immigrants | Poland | 96.4 /100 | #98 | Exceptional 2.4% |
| Immigrants | Israel | 96.1 /100 | #99 | Exceptional 2.4% |
| Europeans | 95.8 /100 | #100 | Exceptional 2.4% |
| Immigrants | Scotland | 95.7 /100 | #101 | Exceptional 2.4% |
| Croatians | 95.0 /100 | #102 | Exceptional 2.4% |
| Alsatians | 94.9 /100 | #103 | Exceptional 2.4% |
| Bhutanese | 94.5 /100 | #104 | Exceptional 2.4% |
| Carpatho Rusyns | 94.4 /100 | #105 | Exceptional 2.4% |
| Immigrants | Indonesia | 94.3 /100 | #106 | Exceptional 2.4% |