Argentinean vs Israeli Self-Care Disability
COMPARE
Argentinean
Israeli
Self-Care Disability
Self-Care Disability Comparison
Argentineans
Israelis
2.3%
SELF-CARE DISABILITY
99.6/ 100
METRIC RATING
54th/ 347
METRIC RANK
2.4%
SELF-CARE DISABILITY
80.0/ 100
METRIC RATING
146th/ 347
METRIC RANK
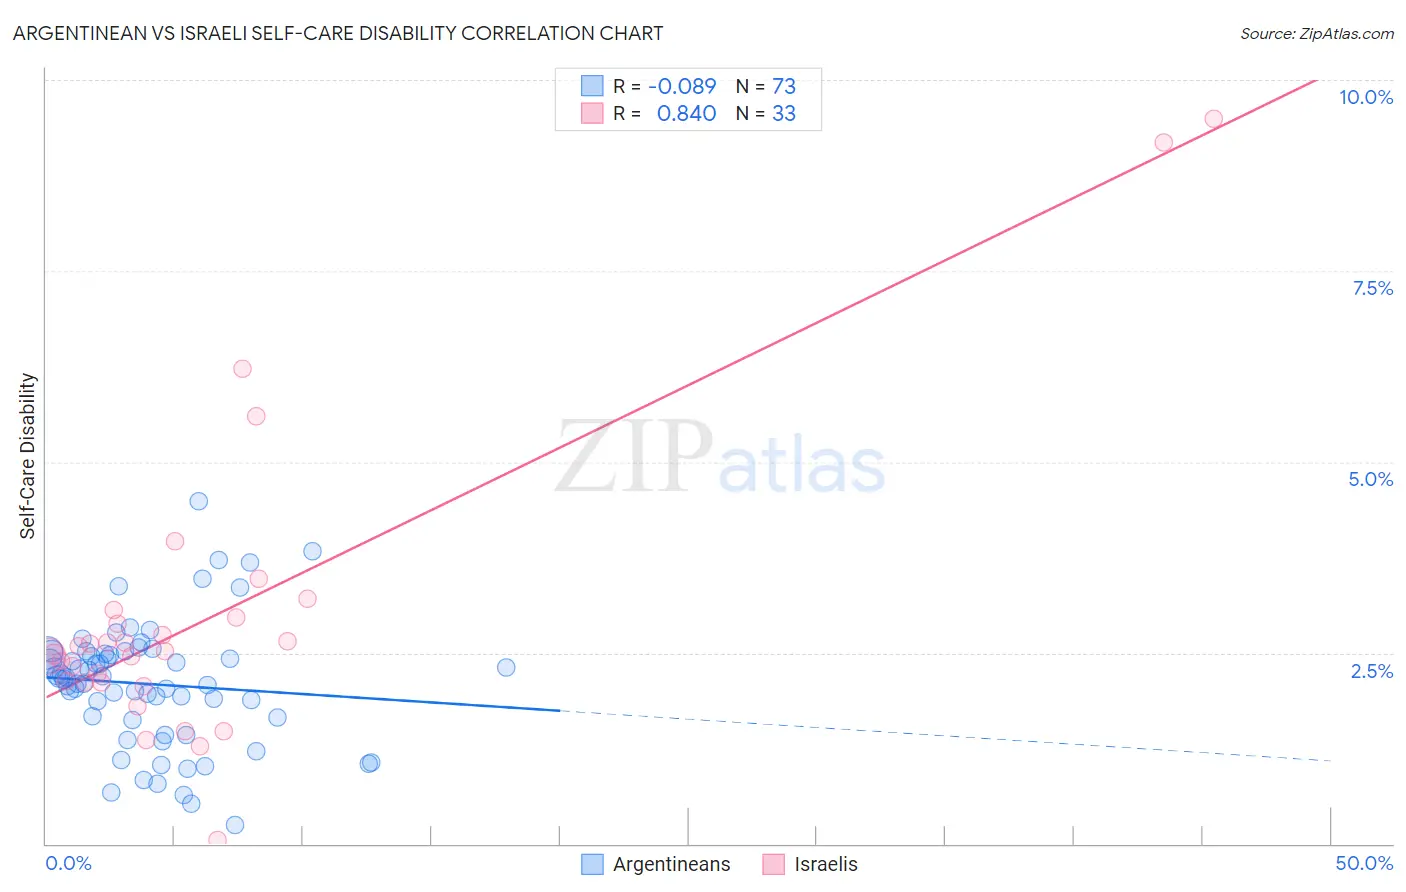
Argentinean vs Israeli Self-Care Disability Correlation Chart
The statistical analysis conducted on geographies consisting of 296,904,932 people shows a slight negative correlation between the proportion of Argentineans and percentage of population with self-care disability in the United States with a correlation coefficient (R) of -0.089 and weighted average of 2.3%. Similarly, the statistical analysis conducted on geographies consisting of 210,973,886 people shows a very strong positive correlation between the proportion of Israelis and percentage of population with self-care disability in the United States with a correlation coefficient (R) of 0.840 and weighted average of 2.4%, a difference of 5.3%.
Self-Care Disability Correlation Summary
| Measurement | Argentinean | Israeli |
| Minimum | 0.24% | 0.046% |
| Maximum | 4.5% | 9.5% |
| Range | 4.2% | 9.4% |
| Mean | 2.1% | 3.0% |
| Median | 2.2% | 2.5% |
| Interquartile 25% (IQ1) | 1.6% | 2.1% |
| Interquartile 75% (IQ3) | 2.5% | 3.0% |
| Interquartile Range (IQR) | 0.85% | 0.90% |
| Standard Deviation (Sample) | 0.81% | 2.0% |
| Standard Deviation (Population) | 0.80% | 2.0% |
Similar Demographics by Self-Care Disability
Demographics Similar to Argentineans by Self-Care Disability
In terms of self-care disability, the demographic groups most similar to Argentineans are Australian (2.3%, a difference of 0.050%), Immigrants from France (2.3%, a difference of 0.060%), Immigrants from Serbia (2.3%, a difference of 0.080%), Kenyan (2.3%, a difference of 0.10%), and Immigrants from Eastern Asia (2.3%, a difference of 0.10%).
| Demographics | Rating | Rank | Self-Care Disability |
| Jordanians | 99.7 /100 | #47 | Exceptional 2.3% |
| Immigrants | Malaysia | 99.7 /100 | #48 | Exceptional 2.3% |
| Latvians | 99.7 /100 | #49 | Exceptional 2.3% |
| Immigrants | Brazil | 99.7 /100 | #50 | Exceptional 2.3% |
| Kenyans | 99.7 /100 | #51 | Exceptional 2.3% |
| Immigrants | Serbia | 99.6 /100 | #52 | Exceptional 2.3% |
| Australians | 99.6 /100 | #53 | Exceptional 2.3% |
| Argentineans | 99.6 /100 | #54 | Exceptional 2.3% |
| Immigrants | France | 99.6 /100 | #55 | Exceptional 2.3% |
| Immigrants | Eastern Asia | 99.6 /100 | #56 | Exceptional 2.3% |
| Immigrants | Belgium | 99.6 /100 | #57 | Exceptional 2.3% |
| Immigrants | Cameroon | 99.6 /100 | #58 | Exceptional 2.3% |
| New Zealanders | 99.5 /100 | #59 | Exceptional 2.3% |
| Immigrants | Japan | 99.5 /100 | #60 | Exceptional 2.3% |
| Palestinians | 99.4 /100 | #61 | Exceptional 2.3% |
Demographics Similar to Israelis by Self-Care Disability
In terms of self-care disability, the demographic groups most similar to Israelis are German (2.4%, a difference of 0.010%), Costa Rican (2.4%, a difference of 0.060%), Afghan (2.4%, a difference of 0.18%), Dutch (2.4%, a difference of 0.18%), and Immigrants from Peru (2.4%, a difference of 0.26%).
| Demographics | Rating | Rank | Self-Care Disability |
| Sri Lankans | 86.6 /100 | #139 | Excellent 2.4% |
| Immigrants | Uruguay | 85.4 /100 | #140 | Excellent 2.4% |
| Alaska Natives | 84.5 /100 | #141 | Excellent 2.4% |
| Immigrants | Peru | 83.2 /100 | #142 | Excellent 2.4% |
| Afghans | 82.3 /100 | #143 | Excellent 2.4% |
| Costa Ricans | 80.8 /100 | #144 | Excellent 2.4% |
| Germans | 80.1 /100 | #145 | Excellent 2.4% |
| Israelis | 80.0 /100 | #146 | Good 2.4% |
| Dutch | 77.5 /100 | #147 | Good 2.4% |
| Romanians | 75.8 /100 | #148 | Good 2.4% |
| Arabs | 75.7 /100 | #149 | Good 2.4% |
| Immigrants | Costa Rica | 75.1 /100 | #150 | Good 2.4% |
| Basques | 74.0 /100 | #151 | Good 2.4% |
| Tlingit-Haida | 73.5 /100 | #152 | Good 2.4% |
| Immigrants | England | 73.5 /100 | #153 | Good 2.4% |