Czech vs Immigrants from Israel Self-Care Disability
COMPARE
Czech
Immigrants from Israel
Self-Care Disability
Self-Care Disability Comparison
Czechs
Immigrants from Israel
2.3%
SELF-CARE DISABILITY
99.8/ 100
METRIC RATING
46th/ 347
METRIC RANK
2.4%
SELF-CARE DISABILITY
96.1/ 100
METRIC RATING
99th/ 347
METRIC RANK
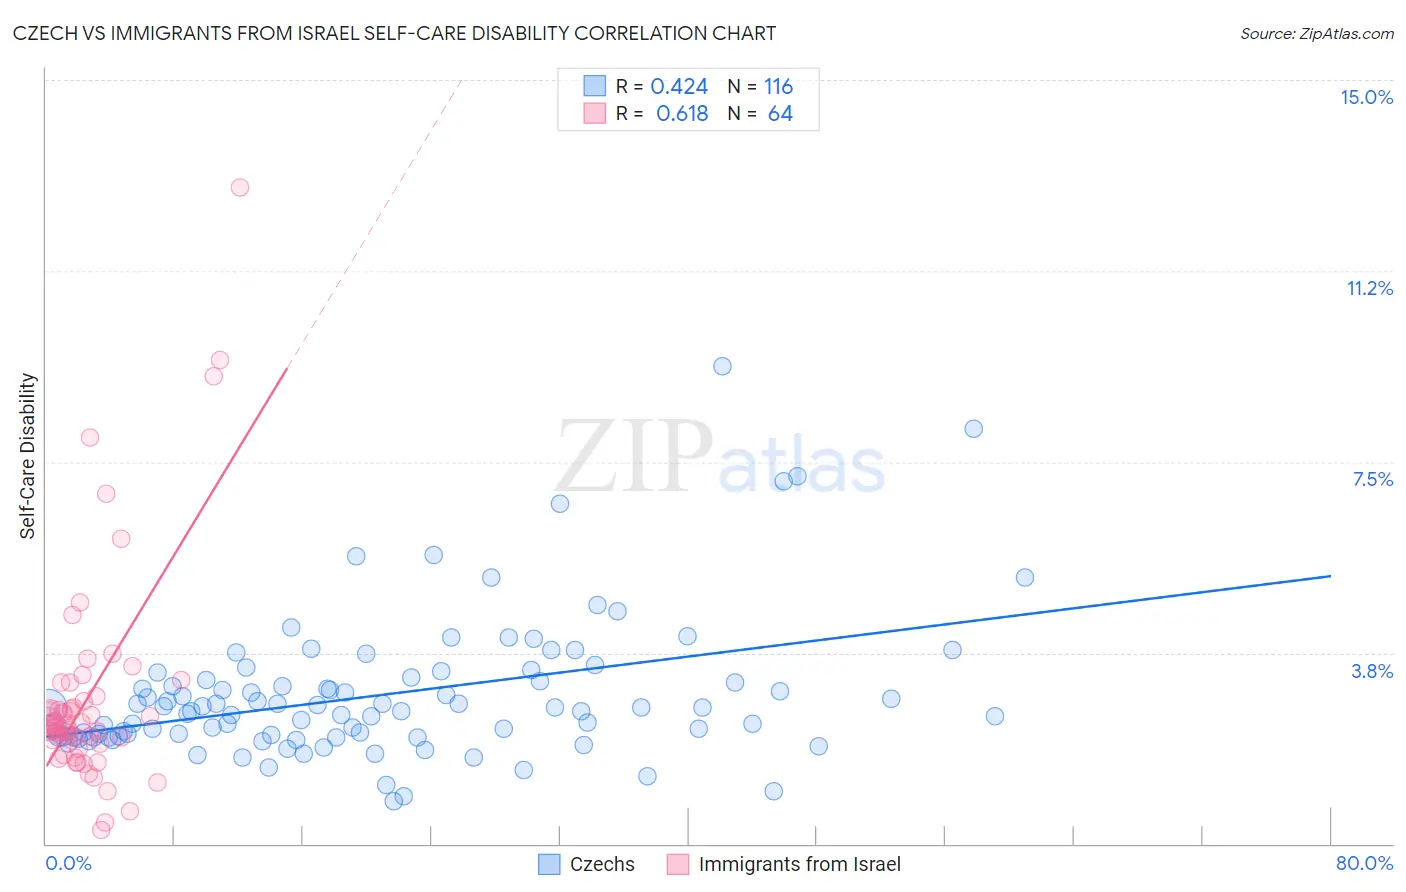
Czech vs Immigrants from Israel Self-Care Disability Correlation Chart
The statistical analysis conducted on geographies consisting of 483,678,458 people shows a moderate positive correlation between the proportion of Czechs and percentage of population with self-care disability in the United States with a correlation coefficient (R) of 0.424 and weighted average of 2.3%. Similarly, the statistical analysis conducted on geographies consisting of 209,935,200 people shows a significant positive correlation between the proportion of Immigrants from Israel and percentage of population with self-care disability in the United States with a correlation coefficient (R) of 0.618 and weighted average of 2.4%, a difference of 3.8%.
Self-Care Disability Correlation Summary
| Measurement | Czech | Immigrants from Israel |
| Minimum | 0.83% | 0.28% |
| Maximum | 9.4% | 12.9% |
| Range | 8.5% | 12.6% |
| Mean | 2.9% | 2.9% |
| Median | 2.6% | 2.3% |
| Interquartile 25% (IQ1) | 2.1% | 2.0% |
| Interquartile 75% (IQ3) | 3.2% | 2.8% |
| Interquartile Range (IQR) | 1.1% | 0.83% |
| Standard Deviation (Sample) | 1.4% | 2.2% |
| Standard Deviation (Population) | 1.4% | 2.1% |
Similar Demographics by Self-Care Disability
Demographics Similar to Czechs by Self-Care Disability
In terms of self-care disability, the demographic groups most similar to Czechs are Norwegian (2.3%, a difference of 0.080%), Immigrants from South Africa (2.3%, a difference of 0.13%), Immigrants from Pakistan (2.3%, a difference of 0.17%), Immigrants from Uganda (2.3%, a difference of 0.22%), and Jordanian (2.3%, a difference of 0.23%).
| Demographics | Rating | Rank | Self-Care Disability |
| Immigrants | Bulgaria | 99.8 /100 | #39 | Exceptional 2.3% |
| Iranians | 99.8 /100 | #40 | Exceptional 2.3% |
| Immigrants | Sudan | 99.8 /100 | #41 | Exceptional 2.3% |
| Immigrants | Uganda | 99.8 /100 | #42 | Exceptional 2.3% |
| Immigrants | Pakistan | 99.8 /100 | #43 | Exceptional 2.3% |
| Immigrants | South Africa | 99.8 /100 | #44 | Exceptional 2.3% |
| Norwegians | 99.8 /100 | #45 | Exceptional 2.3% |
| Czechs | 99.8 /100 | #46 | Exceptional 2.3% |
| Jordanians | 99.7 /100 | #47 | Exceptional 2.3% |
| Immigrants | Malaysia | 99.7 /100 | #48 | Exceptional 2.3% |
| Latvians | 99.7 /100 | #49 | Exceptional 2.3% |
| Immigrants | Brazil | 99.7 /100 | #50 | Exceptional 2.3% |
| Kenyans | 99.7 /100 | #51 | Exceptional 2.3% |
| Immigrants | Serbia | 99.6 /100 | #52 | Exceptional 2.3% |
| Australians | 99.6 /100 | #53 | Exceptional 2.3% |
Demographics Similar to Immigrants from Israel by Self-Care Disability
In terms of self-care disability, the demographic groups most similar to Immigrants from Israel are Immigrants from Poland (2.4%, a difference of 0.080%), European (2.4%, a difference of 0.10%), Immigrants from Scotland (2.4%, a difference of 0.15%), Swiss (2.4%, a difference of 0.17%), and Immigrants from Chile (2.4%, a difference of 0.21%).
| Demographics | Rating | Rank | Self-Care Disability |
| Icelanders | 97.4 /100 | #92 | Exceptional 2.4% |
| Immigrants | Latvia | 97.0 /100 | #93 | Exceptional 2.4% |
| Macedonians | 96.9 /100 | #94 | Exceptional 2.4% |
| Immigrants | Asia | 96.9 /100 | #95 | Exceptional 2.4% |
| Immigrants | Chile | 96.7 /100 | #96 | Exceptional 2.4% |
| Swiss | 96.6 /100 | #97 | Exceptional 2.4% |
| Immigrants | Poland | 96.4 /100 | #98 | Exceptional 2.4% |
| Immigrants | Israel | 96.1 /100 | #99 | Exceptional 2.4% |
| Europeans | 95.8 /100 | #100 | Exceptional 2.4% |
| Immigrants | Scotland | 95.7 /100 | #101 | Exceptional 2.4% |
| Croatians | 95.0 /100 | #102 | Exceptional 2.4% |
| Alsatians | 94.9 /100 | #103 | Exceptional 2.4% |
| Bhutanese | 94.5 /100 | #104 | Exceptional 2.4% |
| Carpatho Rusyns | 94.4 /100 | #105 | Exceptional 2.4% |
| Immigrants | Indonesia | 94.3 /100 | #106 | Exceptional 2.4% |