Argentinean vs Immigrants from Kazakhstan Disability
COMPARE
Argentinean
Immigrants from Kazakhstan
Disability
Disability Comparison
Argentineans
Immigrants from Kazakhstan
10.6%
DISABILITY
100.0/ 100
METRIC RATING
26th/ 347
METRIC RANK
11.3%
DISABILITY
96.4/ 100
METRIC RATING
105th/ 347
METRIC RANK
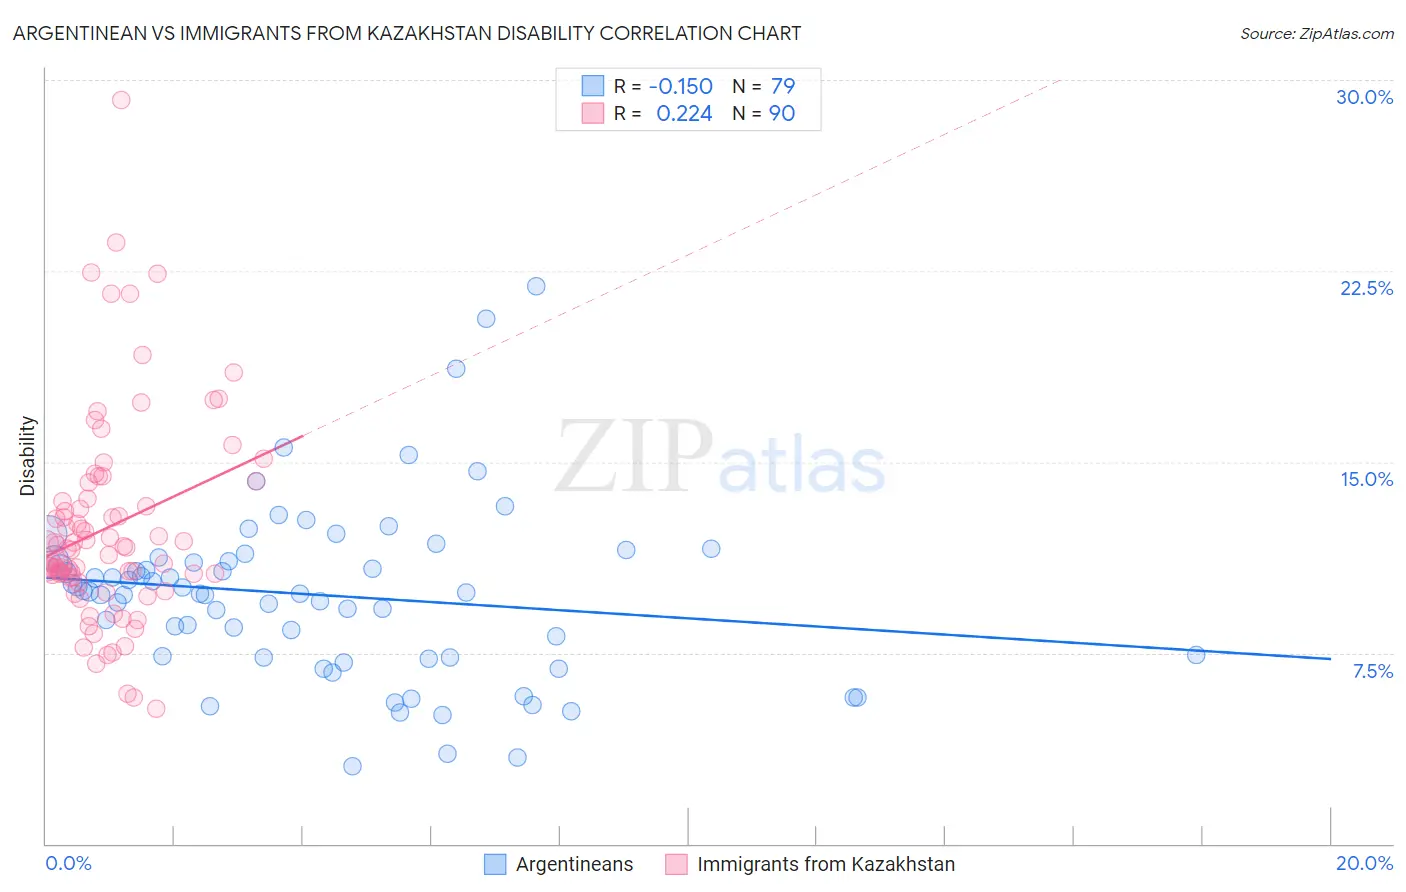
Argentinean vs Immigrants from Kazakhstan Disability Correlation Chart
The statistical analysis conducted on geographies consisting of 297,145,092 people shows a poor negative correlation between the proportion of Argentineans and percentage of population with a disability in the United States with a correlation coefficient (R) of -0.150 and weighted average of 10.6%. Similarly, the statistical analysis conducted on geographies consisting of 124,443,289 people shows a weak positive correlation between the proportion of Immigrants from Kazakhstan and percentage of population with a disability in the United States with a correlation coefficient (R) of 0.224 and weighted average of 11.3%, a difference of 6.5%.
Disability Correlation Summary
| Measurement | Argentinean | Immigrants from Kazakhstan |
| Minimum | 3.1% | 5.3% |
| Maximum | 21.9% | 29.2% |
| Range | 18.8% | 23.9% |
| Mean | 9.8% | 12.4% |
| Median | 9.9% | 11.6% |
| Interquartile 25% (IQ1) | 7.3% | 10.5% |
| Interquartile 75% (IQ3) | 11.2% | 13.6% |
| Interquartile Range (IQR) | 3.9% | 3.1% |
| Standard Deviation (Sample) | 3.4% | 4.1% |
| Standard Deviation (Population) | 3.4% | 4.1% |
Similar Demographics by Disability
Demographics Similar to Argentineans by Disability
In terms of disability, the demographic groups most similar to Argentineans are Cypriot (10.6%, a difference of 0.010%), Immigrants from Malaysia (10.6%, a difference of 0.050%), Egyptian (10.6%, a difference of 0.14%), Immigrants from Argentina (10.6%, a difference of 0.27%), and Immigrants from Turkey (10.6%, a difference of 0.42%).
| Demographics | Rating | Rank | Disability |
| Immigrants | Pakistan | 100.0 /100 | #19 | Exceptional 10.4% |
| Immigrants | Venezuela | 100.0 /100 | #20 | Exceptional 10.4% |
| Asians | 100.0 /100 | #21 | Exceptional 10.4% |
| Immigrants | Sri Lanka | 100.0 /100 | #22 | Exceptional 10.5% |
| Immigrants | Asia | 100.0 /100 | #23 | Exceptional 10.5% |
| Venezuelans | 100.0 /100 | #24 | Exceptional 10.5% |
| Immigrants | Malaysia | 100.0 /100 | #25 | Exceptional 10.6% |
| Argentineans | 100.0 /100 | #26 | Exceptional 10.6% |
| Cypriots | 100.0 /100 | #27 | Exceptional 10.6% |
| Egyptians | 100.0 /100 | #28 | Exceptional 10.6% |
| Immigrants | Argentina | 100.0 /100 | #29 | Exceptional 10.6% |
| Immigrants | Turkey | 100.0 /100 | #30 | Exceptional 10.6% |
| Immigrants | Egypt | 100.0 /100 | #31 | Exceptional 10.6% |
| Paraguayans | 100.0 /100 | #32 | Exceptional 10.6% |
| Immigrants | Kuwait | 100.0 /100 | #33 | Exceptional 10.7% |
Demographics Similar to Immigrants from Kazakhstan by Disability
In terms of disability, the demographic groups most similar to Immigrants from Kazakhstan are Immigrants (11.3%, a difference of 0.010%), Immigrants from Uruguay (11.3%, a difference of 0.020%), Immigrants from Eastern Europe (11.3%, a difference of 0.030%), Nicaraguan (11.3%, a difference of 0.050%), and Immigrants from Eastern Africa (11.3%, a difference of 0.090%).
| Demographics | Rating | Rank | Disability |
| Uruguayans | 97.4 /100 | #98 | Exceptional 11.2% |
| Immigrants | Czechoslovakia | 97.4 /100 | #99 | Exceptional 11.2% |
| Immigrants | Greece | 96.9 /100 | #100 | Exceptional 11.3% |
| Immigrants | Nicaragua | 96.8 /100 | #101 | Exceptional 11.3% |
| Immigrants | Eastern Africa | 96.7 /100 | #102 | Exceptional 11.3% |
| Immigrants | Uruguay | 96.4 /100 | #103 | Exceptional 11.3% |
| Immigrants | Immigrants | 96.4 /100 | #104 | Exceptional 11.3% |
| Immigrants | Kazakhstan | 96.4 /100 | #105 | Exceptional 11.3% |
| Immigrants | Eastern Europe | 96.3 /100 | #106 | Exceptional 11.3% |
| Nicaraguans | 96.2 /100 | #107 | Exceptional 11.3% |
| Immigrants | Nigeria | 96.0 /100 | #108 | Exceptional 11.3% |
| Immigrants | Uganda | 95.7 /100 | #109 | Exceptional 11.3% |
| Immigrants | Denmark | 95.6 /100 | #110 | Exceptional 11.3% |
| Immigrants | South Eastern Asia | 95.4 /100 | #111 | Exceptional 11.3% |
| Immigrants | Uzbekistan | 94.9 /100 | #112 | Exceptional 11.3% |