Argentinean vs Icelander Disability
COMPARE
Argentinean
Icelander
Disability
Disability Comparison
Argentineans
Icelanders
10.6%
DISABILITY
100.0/ 100
METRIC RATING
26th/ 347
METRIC RANK
11.8%
DISABILITY
34.0/ 100
METRIC RATING
182nd/ 347
METRIC RANK
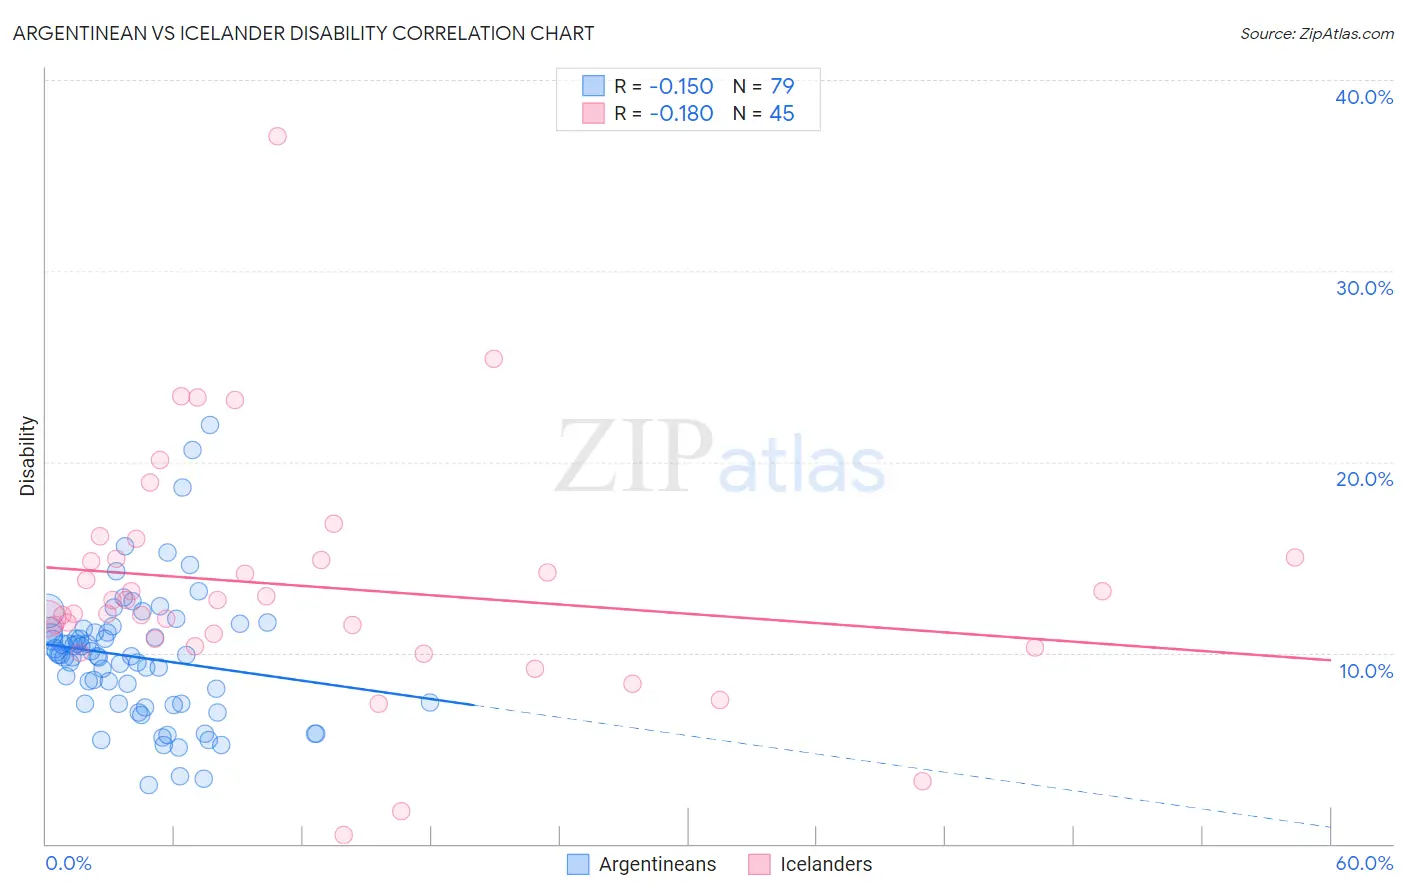
Argentinean vs Icelander Disability Correlation Chart
The statistical analysis conducted on geographies consisting of 297,145,092 people shows a poor negative correlation between the proportion of Argentineans and percentage of population with a disability in the United States with a correlation coefficient (R) of -0.150 and weighted average of 10.6%. Similarly, the statistical analysis conducted on geographies consisting of 159,644,692 people shows a poor negative correlation between the proportion of Icelanders and percentage of population with a disability in the United States with a correlation coefficient (R) of -0.180 and weighted average of 11.8%, a difference of 11.3%.
Disability Correlation Summary
| Measurement | Argentinean | Icelander |
| Minimum | 3.1% | 0.46% |
| Maximum | 21.9% | 37.1% |
| Range | 18.8% | 36.6% |
| Mean | 9.8% | 13.5% |
| Median | 9.9% | 12.7% |
| Interquartile 25% (IQ1) | 7.3% | 10.5% |
| Interquartile 75% (IQ3) | 11.2% | 15.0% |
| Interquartile Range (IQR) | 3.9% | 4.4% |
| Standard Deviation (Sample) | 3.4% | 6.2% |
| Standard Deviation (Population) | 3.4% | 6.2% |
Similar Demographics by Disability
Demographics Similar to Argentineans by Disability
In terms of disability, the demographic groups most similar to Argentineans are Cypriot (10.6%, a difference of 0.010%), Immigrants from Malaysia (10.6%, a difference of 0.050%), Egyptian (10.6%, a difference of 0.14%), Immigrants from Argentina (10.6%, a difference of 0.27%), and Immigrants from Turkey (10.6%, a difference of 0.42%).
| Demographics | Rating | Rank | Disability |
| Immigrants | Pakistan | 100.0 /100 | #19 | Exceptional 10.4% |
| Immigrants | Venezuela | 100.0 /100 | #20 | Exceptional 10.4% |
| Asians | 100.0 /100 | #21 | Exceptional 10.4% |
| Immigrants | Sri Lanka | 100.0 /100 | #22 | Exceptional 10.5% |
| Immigrants | Asia | 100.0 /100 | #23 | Exceptional 10.5% |
| Venezuelans | 100.0 /100 | #24 | Exceptional 10.5% |
| Immigrants | Malaysia | 100.0 /100 | #25 | Exceptional 10.6% |
| Argentineans | 100.0 /100 | #26 | Exceptional 10.6% |
| Cypriots | 100.0 /100 | #27 | Exceptional 10.6% |
| Egyptians | 100.0 /100 | #28 | Exceptional 10.6% |
| Immigrants | Argentina | 100.0 /100 | #29 | Exceptional 10.6% |
| Immigrants | Turkey | 100.0 /100 | #30 | Exceptional 10.6% |
| Immigrants | Egypt | 100.0 /100 | #31 | Exceptional 10.6% |
| Paraguayans | 100.0 /100 | #32 | Exceptional 10.6% |
| Immigrants | Kuwait | 100.0 /100 | #33 | Exceptional 10.7% |
Demographics Similar to Icelanders by Disability
In terms of disability, the demographic groups most similar to Icelanders are Immigrants from Oceania (11.8%, a difference of 0.010%), Honduran (11.8%, a difference of 0.14%), Immigrants from Honduras (11.8%, a difference of 0.19%), Iraqi (11.8%, a difference of 0.20%), and Immigrants from Burma/Myanmar (11.8%, a difference of 0.28%).
| Demographics | Rating | Rank | Disability |
| Haitians | 48.6 /100 | #175 | Average 11.7% |
| Immigrants | Western Africa | 47.5 /100 | #176 | Average 11.7% |
| Immigrants | Central America | 46.6 /100 | #177 | Average 11.7% |
| Greeks | 46.2 /100 | #178 | Average 11.7% |
| Immigrants | Armenia | 41.9 /100 | #179 | Average 11.7% |
| Immigrants | Honduras | 37.8 /100 | #180 | Fair 11.8% |
| Immigrants | Oceania | 34.3 /100 | #181 | Fair 11.8% |
| Icelanders | 34.0 /100 | #182 | Fair 11.8% |
| Hondurans | 31.2 /100 | #183 | Fair 11.8% |
| Iraqis | 30.0 /100 | #184 | Fair 11.8% |
| Immigrants | Burma/Myanmar | 28.5 /100 | #185 | Fair 11.8% |
| Immigrants | Scotland | 28.2 /100 | #186 | Fair 11.8% |
| Lebanese | 27.9 /100 | #187 | Fair 11.8% |
| Immigrants | Mexico | 23.8 /100 | #188 | Fair 11.9% |
| Immigrants | Zaire | 21.8 /100 | #189 | Fair 11.9% |