Argentinean vs Guamanian/Chamorro Disability
COMPARE
Argentinean
Guamanian/Chamorro
Disability
Disability Comparison
Argentineans
Guamanians/Chamorros
10.6%
DISABILITY
100.0/ 100
METRIC RATING
26th/ 347
METRIC RANK
12.3%
DISABILITY
1.4/ 100
METRIC RATING
248th/ 347
METRIC RANK
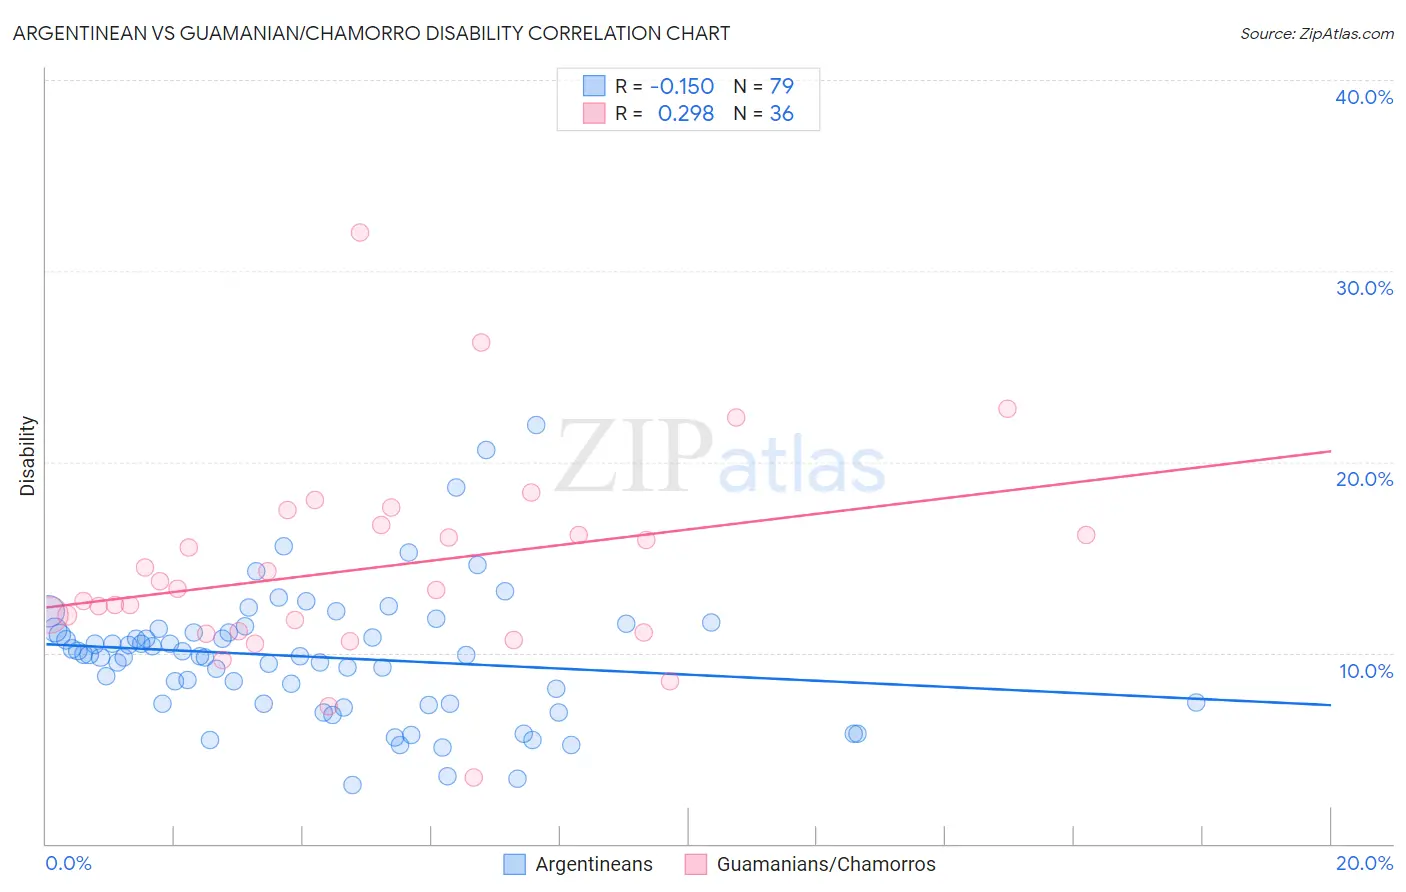
Argentinean vs Guamanian/Chamorro Disability Correlation Chart
The statistical analysis conducted on geographies consisting of 297,145,092 people shows a poor negative correlation between the proportion of Argentineans and percentage of population with a disability in the United States with a correlation coefficient (R) of -0.150 and weighted average of 10.6%. Similarly, the statistical analysis conducted on geographies consisting of 221,898,550 people shows a weak positive correlation between the proportion of Guamanians/Chamorros and percentage of population with a disability in the United States with a correlation coefficient (R) of 0.298 and weighted average of 12.3%, a difference of 15.7%.
Disability Correlation Summary
| Measurement | Argentinean | Guamanian/Chamorro |
| Minimum | 3.1% | 3.4% |
| Maximum | 21.9% | 32.0% |
| Range | 18.8% | 28.6% |
| Mean | 9.8% | 14.4% |
| Median | 9.9% | 13.3% |
| Interquartile 25% (IQ1) | 7.3% | 11.1% |
| Interquartile 75% (IQ3) | 11.2% | 16.4% |
| Interquartile Range (IQR) | 3.9% | 5.3% |
| Standard Deviation (Sample) | 3.4% | 5.3% |
| Standard Deviation (Population) | 3.4% | 5.2% |
Similar Demographics by Disability
Demographics Similar to Argentineans by Disability
In terms of disability, the demographic groups most similar to Argentineans are Cypriot (10.6%, a difference of 0.010%), Immigrants from Malaysia (10.6%, a difference of 0.050%), Egyptian (10.6%, a difference of 0.14%), Immigrants from Argentina (10.6%, a difference of 0.27%), and Immigrants from Turkey (10.6%, a difference of 0.42%).
| Demographics | Rating | Rank | Disability |
| Immigrants | Pakistan | 100.0 /100 | #19 | Exceptional 10.4% |
| Immigrants | Venezuela | 100.0 /100 | #20 | Exceptional 10.4% |
| Asians | 100.0 /100 | #21 | Exceptional 10.4% |
| Immigrants | Sri Lanka | 100.0 /100 | #22 | Exceptional 10.5% |
| Immigrants | Asia | 100.0 /100 | #23 | Exceptional 10.5% |
| Venezuelans | 100.0 /100 | #24 | Exceptional 10.5% |
| Immigrants | Malaysia | 100.0 /100 | #25 | Exceptional 10.6% |
| Argentineans | 100.0 /100 | #26 | Exceptional 10.6% |
| Cypriots | 100.0 /100 | #27 | Exceptional 10.6% |
| Egyptians | 100.0 /100 | #28 | Exceptional 10.6% |
| Immigrants | Argentina | 100.0 /100 | #29 | Exceptional 10.6% |
| Immigrants | Turkey | 100.0 /100 | #30 | Exceptional 10.6% |
| Immigrants | Egypt | 100.0 /100 | #31 | Exceptional 10.6% |
| Paraguayans | 100.0 /100 | #32 | Exceptional 10.6% |
| Immigrants | Kuwait | 100.0 /100 | #33 | Exceptional 10.7% |
Demographics Similar to Guamanians/Chamorros by Disability
In terms of disability, the demographic groups most similar to Guamanians/Chamorros are Carpatho Rusyn (12.3%, a difference of 0.010%), Subsaharan African (12.3%, a difference of 0.020%), European (12.3%, a difference of 0.020%), Indonesian (12.2%, a difference of 0.040%), and Swiss (12.2%, a difference of 0.070%).
| Demographics | Rating | Rank | Disability |
| Yugoslavians | 1.7 /100 | #241 | Tragic 12.2% |
| Poles | 1.7 /100 | #242 | Tragic 12.2% |
| British | 1.5 /100 | #243 | Tragic 12.2% |
| Basques | 1.5 /100 | #244 | Tragic 12.2% |
| Liberians | 1.5 /100 | #245 | Tragic 12.2% |
| Swiss | 1.5 /100 | #246 | Tragic 12.2% |
| Indonesians | 1.4 /100 | #247 | Tragic 12.2% |
| Guamanians/Chamorros | 1.4 /100 | #248 | Tragic 12.3% |
| Carpatho Rusyns | 1.4 /100 | #249 | Tragic 12.3% |
| Sub-Saharan Africans | 1.4 /100 | #250 | Tragic 12.3% |
| Europeans | 1.4 /100 | #251 | Tragic 12.3% |
| Bermudans | 1.1 /100 | #252 | Tragic 12.3% |
| Belgians | 0.8 /100 | #253 | Tragic 12.3% |
| German Russians | 0.8 /100 | #254 | Tragic 12.3% |
| Slovenes | 0.6 /100 | #255 | Tragic 12.4% |