Argentinean vs Jordanian Disability
COMPARE
Argentinean
Jordanian
Disability
Disability Comparison
Argentineans
Jordanians
10.6%
DISABILITY
100.0/ 100
METRIC RATING
26th/ 347
METRIC RANK
10.9%
DISABILITY
99.8/ 100
METRIC RATING
54th/ 347
METRIC RANK
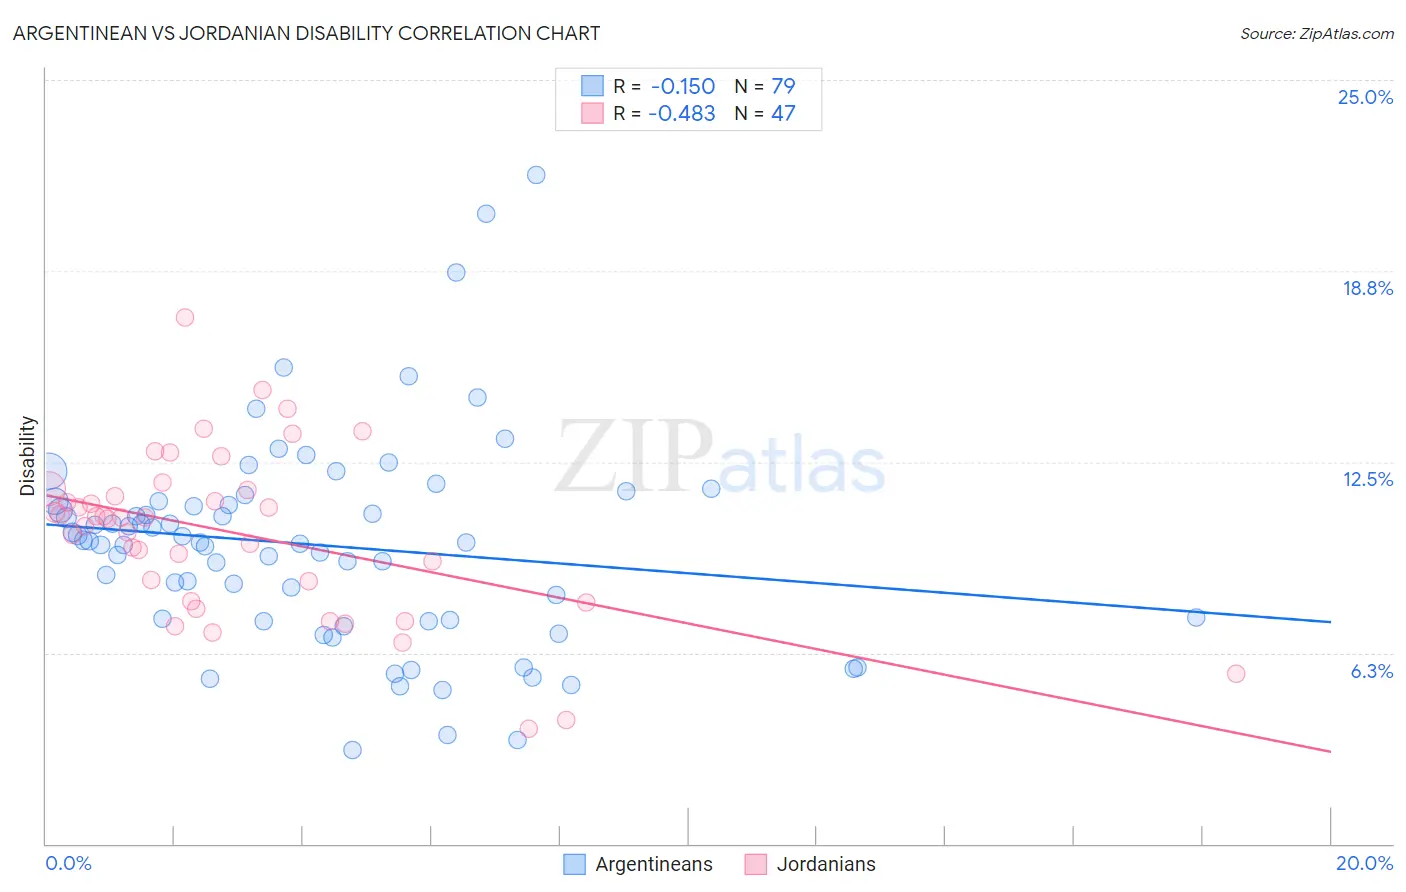
Argentinean vs Jordanian Disability Correlation Chart
The statistical analysis conducted on geographies consisting of 297,145,092 people shows a poor negative correlation between the proportion of Argentineans and percentage of population with a disability in the United States with a correlation coefficient (R) of -0.150 and weighted average of 10.6%. Similarly, the statistical analysis conducted on geographies consisting of 166,416,962 people shows a moderate negative correlation between the proportion of Jordanians and percentage of population with a disability in the United States with a correlation coefficient (R) of -0.483 and weighted average of 10.9%, a difference of 2.6%.
Disability Correlation Summary
| Measurement | Argentinean | Jordanian |
| Minimum | 3.1% | 3.7% |
| Maximum | 21.9% | 17.2% |
| Range | 18.8% | 13.5% |
| Mean | 9.8% | 10.2% |
| Median | 9.9% | 10.7% |
| Interquartile 25% (IQ1) | 7.3% | 7.9% |
| Interquartile 75% (IQ3) | 11.2% | 11.6% |
| Interquartile Range (IQR) | 3.9% | 3.7% |
| Standard Deviation (Sample) | 3.4% | 2.7% |
| Standard Deviation (Population) | 3.4% | 2.7% |
Similar Demographics by Disability
Demographics Similar to Argentineans by Disability
In terms of disability, the demographic groups most similar to Argentineans are Cypriot (10.6%, a difference of 0.010%), Immigrants from Malaysia (10.6%, a difference of 0.050%), Egyptian (10.6%, a difference of 0.14%), Immigrants from Argentina (10.6%, a difference of 0.27%), and Immigrants from Turkey (10.6%, a difference of 0.42%).
| Demographics | Rating | Rank | Disability |
| Immigrants | Pakistan | 100.0 /100 | #19 | Exceptional 10.4% |
| Immigrants | Venezuela | 100.0 /100 | #20 | Exceptional 10.4% |
| Asians | 100.0 /100 | #21 | Exceptional 10.4% |
| Immigrants | Sri Lanka | 100.0 /100 | #22 | Exceptional 10.5% |
| Immigrants | Asia | 100.0 /100 | #23 | Exceptional 10.5% |
| Venezuelans | 100.0 /100 | #24 | Exceptional 10.5% |
| Immigrants | Malaysia | 100.0 /100 | #25 | Exceptional 10.6% |
| Argentineans | 100.0 /100 | #26 | Exceptional 10.6% |
| Cypriots | 100.0 /100 | #27 | Exceptional 10.6% |
| Egyptians | 100.0 /100 | #28 | Exceptional 10.6% |
| Immigrants | Argentina | 100.0 /100 | #29 | Exceptional 10.6% |
| Immigrants | Turkey | 100.0 /100 | #30 | Exceptional 10.6% |
| Immigrants | Egypt | 100.0 /100 | #31 | Exceptional 10.6% |
| Paraguayans | 100.0 /100 | #32 | Exceptional 10.6% |
| Immigrants | Kuwait | 100.0 /100 | #33 | Exceptional 10.7% |
Demographics Similar to Jordanians by Disability
In terms of disability, the demographic groups most similar to Jordanians are Immigrants from Spain (10.9%, a difference of 0.0%), South American (10.9%, a difference of 0.020%), Peruvian (10.9%, a difference of 0.080%), Vietnamese (10.9%, a difference of 0.090%), and Immigrants from Saudi Arabia (10.9%, a difference of 0.090%).
| Demographics | Rating | Rank | Disability |
| Taiwanese | 99.9 /100 | #47 | Exceptional 10.8% |
| Soviet Union | 99.9 /100 | #48 | Exceptional 10.9% |
| Vietnamese | 99.9 /100 | #49 | Exceptional 10.9% |
| Immigrants | Saudi Arabia | 99.9 /100 | #50 | Exceptional 10.9% |
| Peruvians | 99.8 /100 | #51 | Exceptional 10.9% |
| South Americans | 99.8 /100 | #52 | Exceptional 10.9% |
| Immigrants | Spain | 99.8 /100 | #53 | Exceptional 10.9% |
| Jordanians | 99.8 /100 | #54 | Exceptional 10.9% |
| Immigrants | El Salvador | 99.8 /100 | #55 | Exceptional 10.9% |
| Immigrants | Lithuania | 99.8 /100 | #56 | Exceptional 10.9% |
| Salvadorans | 99.8 /100 | #57 | Exceptional 10.9% |
| Immigrants | South America | 99.8 /100 | #58 | Exceptional 10.9% |
| Immigrants | Colombia | 99.7 /100 | #59 | Exceptional 10.9% |
| Zimbabweans | 99.7 /100 | #60 | Exceptional 10.9% |
| Immigrants | Bulgaria | 99.7 /100 | #61 | Exceptional 10.9% |