Arab vs Immigrants from Jamaica Hearing Disability
COMPARE
Arab
Immigrants from Jamaica
Hearing Disability
Hearing Disability Comparison
Arabs
Immigrants from Jamaica
3.0%
HEARING DISABILITY
57.6/ 100
METRIC RATING
169th/ 347
METRIC RANK
2.6%
HEARING DISABILITY
99.5/ 100
METRIC RATING
38th/ 347
METRIC RANK
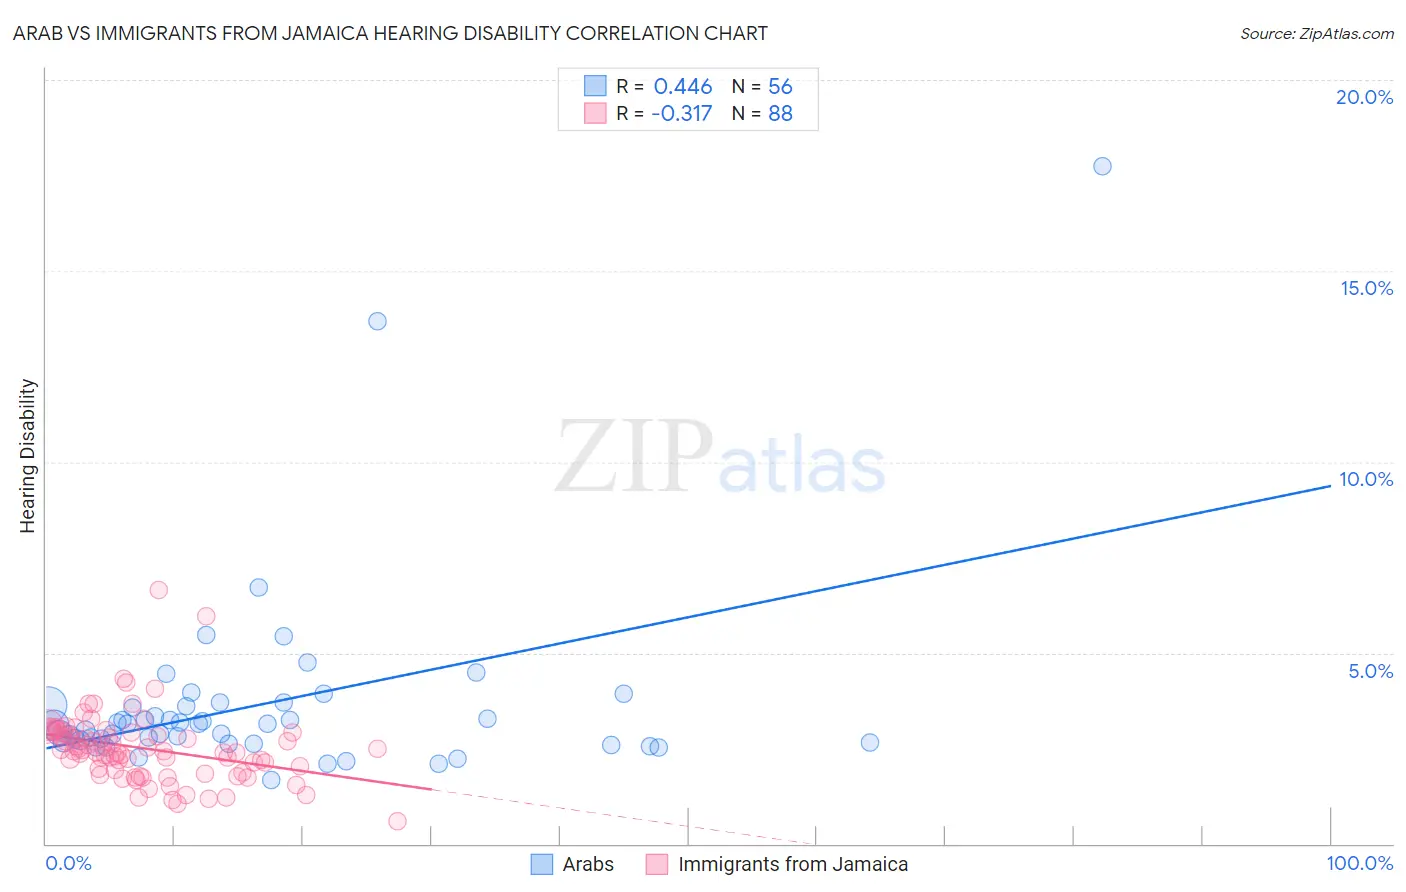
Arab vs Immigrants from Jamaica Hearing Disability Correlation Chart
The statistical analysis conducted on geographies consisting of 486,579,834 people shows a moderate positive correlation between the proportion of Arabs and percentage of population with hearing disability in the United States with a correlation coefficient (R) of 0.446 and weighted average of 3.0%. Similarly, the statistical analysis conducted on geographies consisting of 301,631,543 people shows a mild negative correlation between the proportion of Immigrants from Jamaica and percentage of population with hearing disability in the United States with a correlation coefficient (R) of -0.317 and weighted average of 2.6%, a difference of 13.6%.
Hearing Disability Correlation Summary
| Measurement | Arab | Immigrants from Jamaica |
| Minimum | 1.7% | 0.58% |
| Maximum | 17.8% | 6.6% |
| Range | 16.1% | 6.0% |
| Mean | 3.6% | 2.5% |
| Median | 3.1% | 2.4% |
| Interquartile 25% (IQ1) | 2.7% | 1.9% |
| Interquartile 75% (IQ3) | 3.6% | 2.9% |
| Interquartile Range (IQR) | 0.96% | 1.0% |
| Standard Deviation (Sample) | 2.5% | 0.92% |
| Standard Deviation (Population) | 2.5% | 0.92% |
Similar Demographics by Hearing Disability
Demographics Similar to Arabs by Hearing Disability
In terms of hearing disability, the demographic groups most similar to Arabs are Immigrants from Greece (3.0%, a difference of 0.030%), Immigrants from Eastern Europe (3.0%, a difference of 0.040%), Immigrants from Cabo Verde (3.0%, a difference of 0.070%), Immigrants from Ukraine (3.0%, a difference of 0.10%), and Armenian (3.0%, a difference of 0.15%).
| Demographics | Rating | Rank | Hearing Disability |
| Immigrants | Japan | 66.3 /100 | #162 | Good 2.9% |
| Immigrants | Central America | 64.9 /100 | #163 | Good 3.0% |
| Immigrants | Cambodia | 64.8 /100 | #164 | Good 3.0% |
| Immigrants | Zimbabwe | 64.2 /100 | #165 | Good 3.0% |
| Immigrants | South Eastern Asia | 62.9 /100 | #166 | Good 3.0% |
| Immigrants | Eastern Europe | 58.1 /100 | #167 | Average 3.0% |
| Immigrants | Greece | 57.9 /100 | #168 | Average 3.0% |
| Arabs | 57.6 /100 | #169 | Average 3.0% |
| Immigrants | Cabo Verde | 56.9 /100 | #170 | Average 3.0% |
| Immigrants | Ukraine | 56.6 /100 | #171 | Average 3.0% |
| Armenians | 56.0 /100 | #172 | Average 3.0% |
| Immigrants | Serbia | 51.1 /100 | #173 | Average 3.0% |
| Indonesians | 50.0 /100 | #174 | Average 3.0% |
| Immigrants | Romania | 48.4 /100 | #175 | Average 3.0% |
| Panamanians | 47.0 /100 | #176 | Average 3.0% |
Demographics Similar to Immigrants from Jamaica by Hearing Disability
In terms of hearing disability, the demographic groups most similar to Immigrants from Jamaica are Immigrants from Western Africa (2.6%, a difference of 0.080%), Okinawan (2.6%, a difference of 0.11%), Immigrants from China (2.6%, a difference of 0.24%), Haitian (2.6%, a difference of 0.32%), and Salvadoran (2.6%, a difference of 0.33%).
| Demographics | Rating | Rank | Hearing Disability |
| Immigrants | Cameroon | 99.7 /100 | #31 | Exceptional 2.6% |
| Immigrants | Venezuela | 99.7 /100 | #32 | Exceptional 2.6% |
| Filipinos | 99.6 /100 | #33 | Exceptional 2.6% |
| Immigrants | Pakistan | 99.6 /100 | #34 | Exceptional 2.6% |
| Salvadorans | 99.6 /100 | #35 | Exceptional 2.6% |
| Okinawans | 99.6 /100 | #36 | Exceptional 2.6% |
| Immigrants | Western Africa | 99.6 /100 | #37 | Exceptional 2.6% |
| Immigrants | Jamaica | 99.5 /100 | #38 | Exceptional 2.6% |
| Immigrants | China | 99.5 /100 | #39 | Exceptional 2.6% |
| Haitians | 99.5 /100 | #40 | Exceptional 2.6% |
| Immigrants | Taiwan | 99.4 /100 | #41 | Exceptional 2.6% |
| West Indians | 99.4 /100 | #42 | Exceptional 2.6% |
| Senegalese | 99.4 /100 | #43 | Exceptional 2.6% |
| Nigerians | 99.4 /100 | #44 | Exceptional 2.6% |
| Venezuelans | 99.4 /100 | #45 | Exceptional 2.6% |