Arab vs Immigrants from Switzerland Male Disability
COMPARE
Arab
Immigrants from Switzerland
Male Disability
Male Disability Comparison
Arabs
Immigrants from Switzerland
11.0%
MALE DISABILITY
81.5/ 100
METRIC RATING
141st/ 347
METRIC RANK
10.7%
MALE DISABILITY
96.1/ 100
METRIC RATING
99th/ 347
METRIC RANK
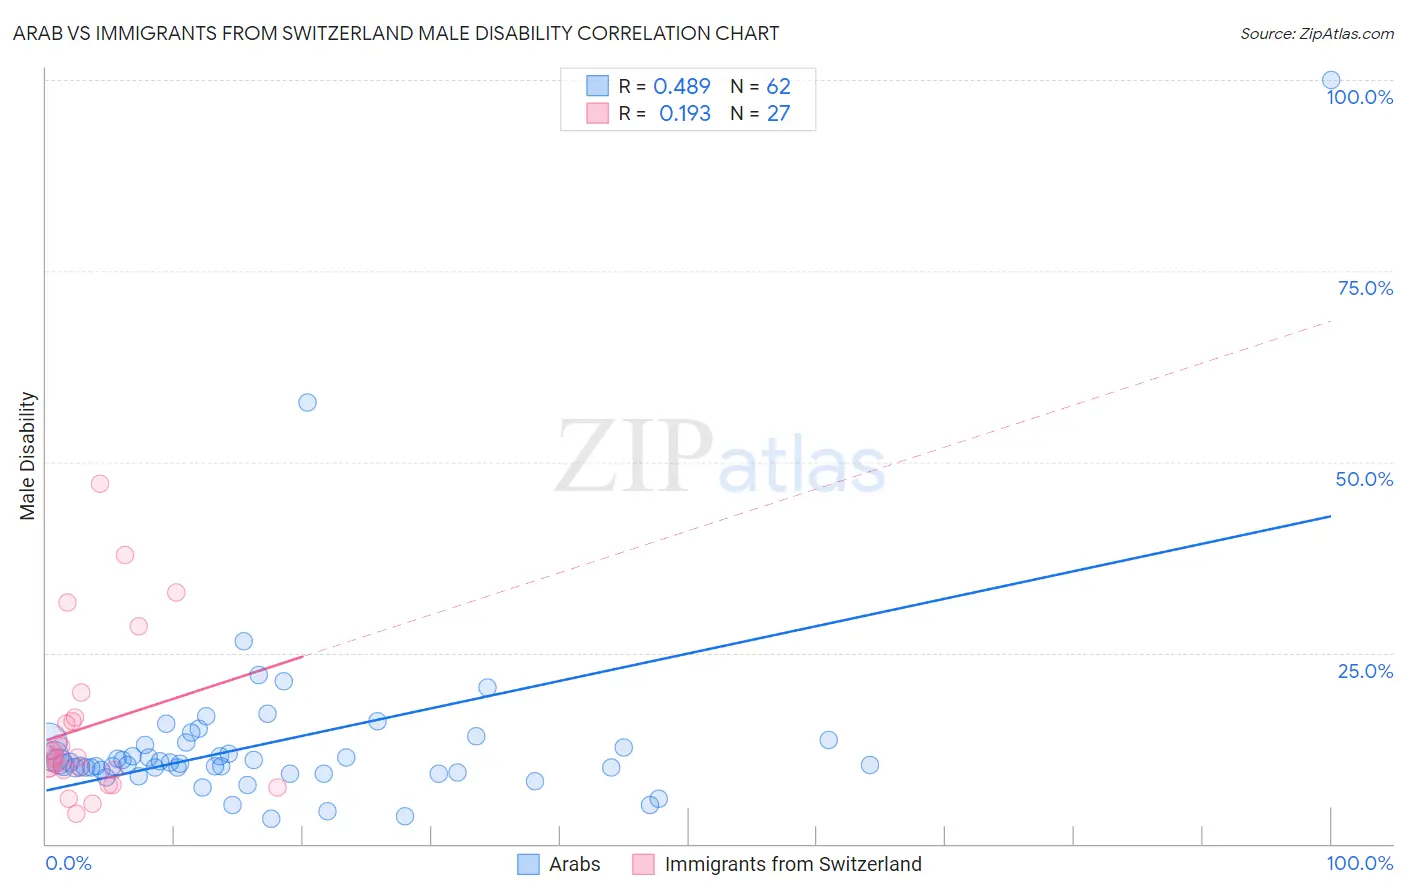
Arab vs Immigrants from Switzerland Male Disability Correlation Chart
The statistical analysis conducted on geographies consisting of 486,768,170 people shows a moderate positive correlation between the proportion of Arabs and percentage of males with a disability in the United States with a correlation coefficient (R) of 0.489 and weighted average of 11.0%. Similarly, the statistical analysis conducted on geographies consisting of 148,082,366 people shows a poor positive correlation between the proportion of Immigrants from Switzerland and percentage of males with a disability in the United States with a correlation coefficient (R) of 0.193 and weighted average of 10.7%, a difference of 2.5%.
Male Disability Correlation Summary
| Measurement | Arab | Immigrants from Switzerland |
| Minimum | 3.3% | 4.0% |
| Maximum | 100.0% | 47.1% |
| Range | 96.7% | 43.1% |
| Mean | 13.5% | 15.4% |
| Median | 10.5% | 11.3% |
| Interquartile 25% (IQ1) | 9.6% | 9.6% |
| Interquartile 75% (IQ3) | 13.2% | 16.6% |
| Interquartile Range (IQR) | 3.6% | 7.0% |
| Standard Deviation (Sample) | 13.3% | 10.8% |
| Standard Deviation (Population) | 13.2% | 10.6% |
Similar Demographics by Male Disability
Demographics Similar to Arabs by Male Disability
In terms of male disability, the demographic groups most similar to Arabs are Immigrants from Italy (11.0%, a difference of 0.0%), Immigrants from Sudan (11.0%, a difference of 0.0%), South African (11.0%, a difference of 0.020%), Nigerian (11.0%, a difference of 0.040%), and Immigrants from Europe (11.0%, a difference of 0.050%).
| Demographics | Rating | Rank | Male Disability |
| Bhutanese | 83.4 /100 | #134 | Excellent 11.0% |
| Trinidadians and Tobagonians | 83.3 /100 | #135 | Excellent 11.0% |
| Immigrants | Costa Rica | 82.8 /100 | #136 | Excellent 11.0% |
| Immigrants | Europe | 82.0 /100 | #137 | Excellent 11.0% |
| Nigerians | 81.9 /100 | #138 | Excellent 11.0% |
| South Africans | 81.7 /100 | #139 | Excellent 11.0% |
| Immigrants | Italy | 81.5 /100 | #140 | Excellent 11.0% |
| Arabs | 81.5 /100 | #141 | Excellent 11.0% |
| Immigrants | Sudan | 81.5 /100 | #142 | Excellent 11.0% |
| Moroccans | 80.7 /100 | #143 | Excellent 11.0% |
| Kenyans | 78.1 /100 | #144 | Good 11.0% |
| Costa Ricans | 78.0 /100 | #145 | Good 11.0% |
| Koreans | 77.5 /100 | #146 | Good 11.0% |
| Immigrants | Croatia | 77.3 /100 | #147 | Good 11.0% |
| Sudanese | 77.1 /100 | #148 | Good 11.0% |
Demographics Similar to Immigrants from Switzerland by Male Disability
In terms of male disability, the demographic groups most similar to Immigrants from Switzerland are Immigrants from Kazakhstan (10.7%, a difference of 0.070%), Immigrants from Romania (10.7%, a difference of 0.14%), Immigrants from Greece (10.7%, a difference of 0.18%), Immigrants from Armenia (10.7%, a difference of 0.20%), and Nicaraguan (10.7%, a difference of 0.22%).
| Demographics | Rating | Rank | Male Disability |
| Palestinians | 97.4 /100 | #92 | Exceptional 10.7% |
| Immigrants | St. Vincent and the Grenadines | 97.1 /100 | #93 | Exceptional 10.7% |
| Immigrants | Sweden | 96.9 /100 | #94 | Exceptional 10.7% |
| Chileans | 96.9 /100 | #95 | Exceptional 10.7% |
| Nicaraguans | 96.6 /100 | #96 | Exceptional 10.7% |
| Immigrants | Armenia | 96.6 /100 | #97 | Exceptional 10.7% |
| Immigrants | Romania | 96.5 /100 | #98 | Exceptional 10.7% |
| Immigrants | Switzerland | 96.1 /100 | #99 | Exceptional 10.7% |
| Immigrants | Kazakhstan | 95.9 /100 | #100 | Exceptional 10.7% |
| Immigrants | Greece | 95.6 /100 | #101 | Exceptional 10.7% |
| Immigrants | Eastern Europe | 95.3 /100 | #102 | Exceptional 10.7% |
| Uruguayans | 95.3 /100 | #103 | Exceptional 10.7% |
| Immigrants | Nigeria | 95.1 /100 | #104 | Exceptional 10.8% |
| Immigrants | Brazil | 95.0 /100 | #105 | Exceptional 10.8% |
| Immigrants | Syria | 94.9 /100 | #106 | Exceptional 10.8% |