Arab vs Macedonian Unemployment Among Ages 55 to 59 years
COMPARE
Arab
Macedonian
Unemployment Among Ages 55 to 59 years
Unemployment Among Ages 55 to 59 years Comparison
Arabs
Macedonians
4.8%
UNEMPLOYMENT AMONG AGES 55 TO 59 YEARS
44.7/ 100
METRIC RATING
178th/ 347
METRIC RANK
4.9%
UNEMPLOYMENT AMONG AGES 55 TO 59 YEARS
26.4/ 100
METRIC RATING
197th/ 347
METRIC RANK
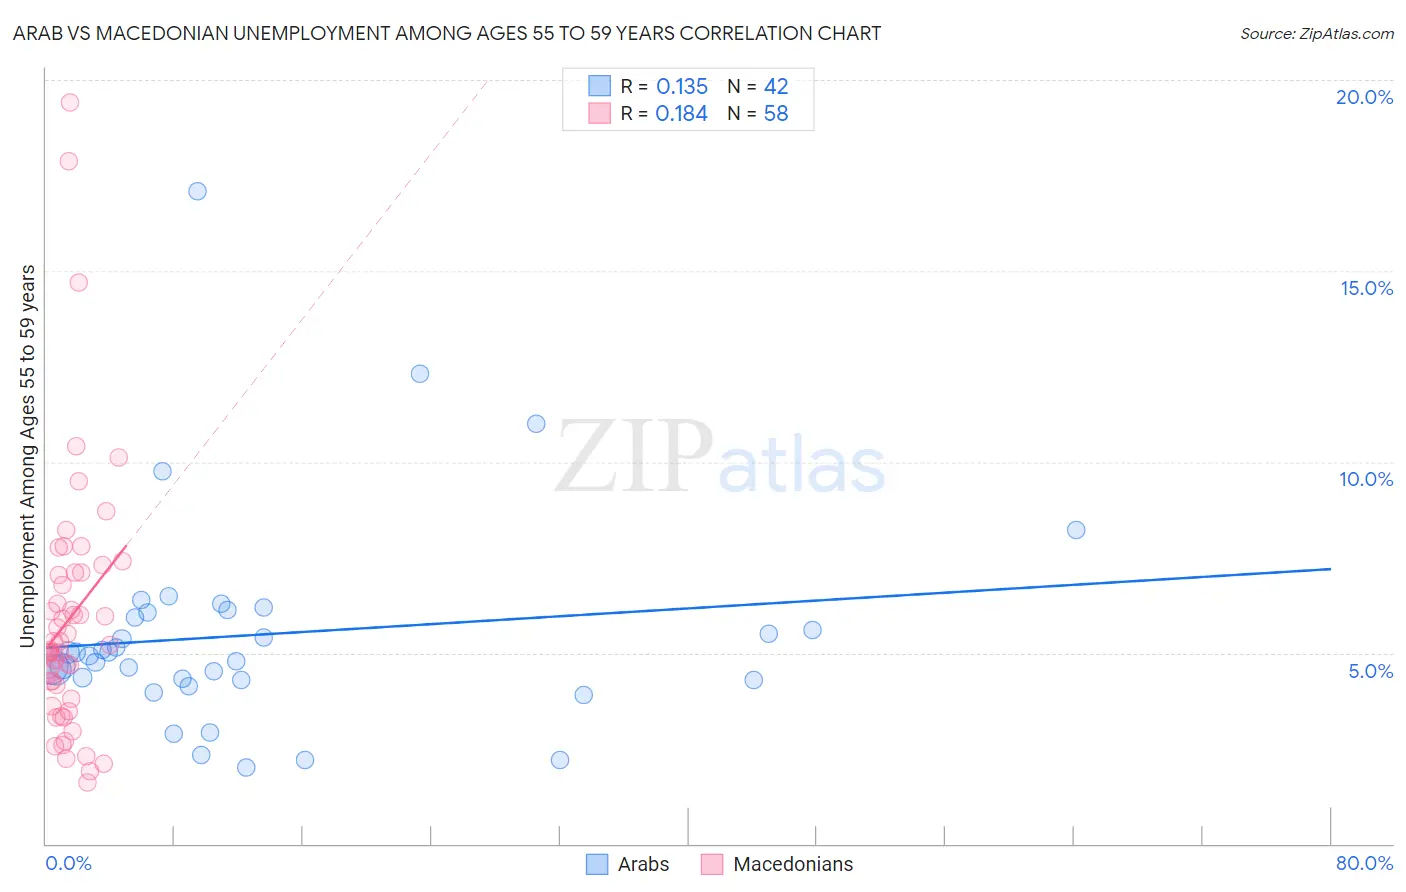
Arab vs Macedonian Unemployment Among Ages 55 to 59 years Correlation Chart
The statistical analysis conducted on geographies consisting of 441,814,241 people shows a poor positive correlation between the proportion of Arabs and unemployment rate among population between the ages 55 and 59 in the United States with a correlation coefficient (R) of 0.135 and weighted average of 4.8%. Similarly, the statistical analysis conducted on geographies consisting of 128,838,233 people shows a poor positive correlation between the proportion of Macedonians and unemployment rate among population between the ages 55 and 59 in the United States with a correlation coefficient (R) of 0.184 and weighted average of 4.9%, a difference of 0.82%.
Unemployment Among Ages 55 to 59 years Correlation Summary
| Measurement | Arab | Macedonian |
| Minimum | 2.0% | 1.6% |
| Maximum | 17.1% | 19.4% |
| Range | 15.1% | 17.8% |
| Mean | 5.5% | 5.9% |
| Median | 5.0% | 5.1% |
| Interquartile 25% (IQ1) | 4.3% | 3.8% |
| Interquartile 75% (IQ3) | 6.1% | 7.1% |
| Interquartile Range (IQR) | 1.8% | 3.3% |
| Standard Deviation (Sample) | 2.8% | 3.4% |
| Standard Deviation (Population) | 2.7% | 3.4% |
Demographics Similar to Arabs and Macedonians by Unemployment Among Ages 55 to 59 years
In terms of unemployment among ages 55 to 59 years, the demographic groups most similar to Arabs are Hungarian (4.8%, a difference of 0.020%), South American (4.8%, a difference of 0.030%), Immigrants from Sri Lanka (4.8%, a difference of 0.090%), Immigrants from Hungary (4.8%, a difference of 0.18%), and Immigrants from Europe (4.8%, a difference of 0.18%). Similarly, the demographic groups most similar to Macedonians are Eastern European (4.9%, a difference of 0.010%), Spaniard (4.9%, a difference of 0.040%), Estonian (4.9%, a difference of 0.040%), Immigrants from Italy (4.9%, a difference of 0.18%), and Immigrants from Ukraine (4.9%, a difference of 0.26%).
| Demographics | Rating | Rank | Unemployment Among Ages 55 to 59 years |
| Immigrants | Sri Lanka | 46.8 /100 | #177 | Average 4.8% |
| Arabs | 44.7 /100 | #178 | Average 4.8% |
| Hungarians | 44.3 /100 | #179 | Average 4.8% |
| South Americans | 44.0 /100 | #180 | Average 4.8% |
| Immigrants | Hungary | 40.4 /100 | #181 | Average 4.8% |
| Immigrants | Europe | 40.4 /100 | #182 | Average 4.8% |
| Immigrants | Peru | 38.6 /100 | #183 | Fair 4.8% |
| Immigrants | Czechoslovakia | 38.0 /100 | #184 | Fair 4.8% |
| Peruvians | 37.0 /100 | #185 | Fair 4.8% |
| Osage | 37.0 /100 | #186 | Fair 4.8% |
| Immigrants | Morocco | 36.5 /100 | #187 | Fair 4.8% |
| Immigrants | Eastern Asia | 36.1 /100 | #188 | Fair 4.8% |
| Iroquois | 34.5 /100 | #189 | Fair 4.9% |
| Russians | 33.9 /100 | #190 | Fair 4.9% |
| Iranians | 32.4 /100 | #191 | Fair 4.9% |
| Immigrants | Ukraine | 31.7 /100 | #192 | Fair 4.9% |
| Immigrants | Italy | 30.1 /100 | #193 | Fair 4.9% |
| Spaniards | 27.2 /100 | #194 | Fair 4.9% |
| Estonians | 27.2 /100 | #195 | Fair 4.9% |
| Eastern Europeans | 26.7 /100 | #196 | Fair 4.9% |
| Macedonians | 26.4 /100 | #197 | Fair 4.9% |