Arab vs Immigrants from Denmark Bachelor's Degree
COMPARE
Arab
Immigrants from Denmark
Bachelor's Degree
Bachelor's Degree Comparison
Arabs
Immigrants from Denmark
40.9%
BACHELOR'S DEGREE
96.6/ 100
METRIC RATING
109th/ 347
METRIC RANK
45.4%
BACHELOR'S DEGREE
100.0/ 100
METRIC RATING
34th/ 347
METRIC RANK
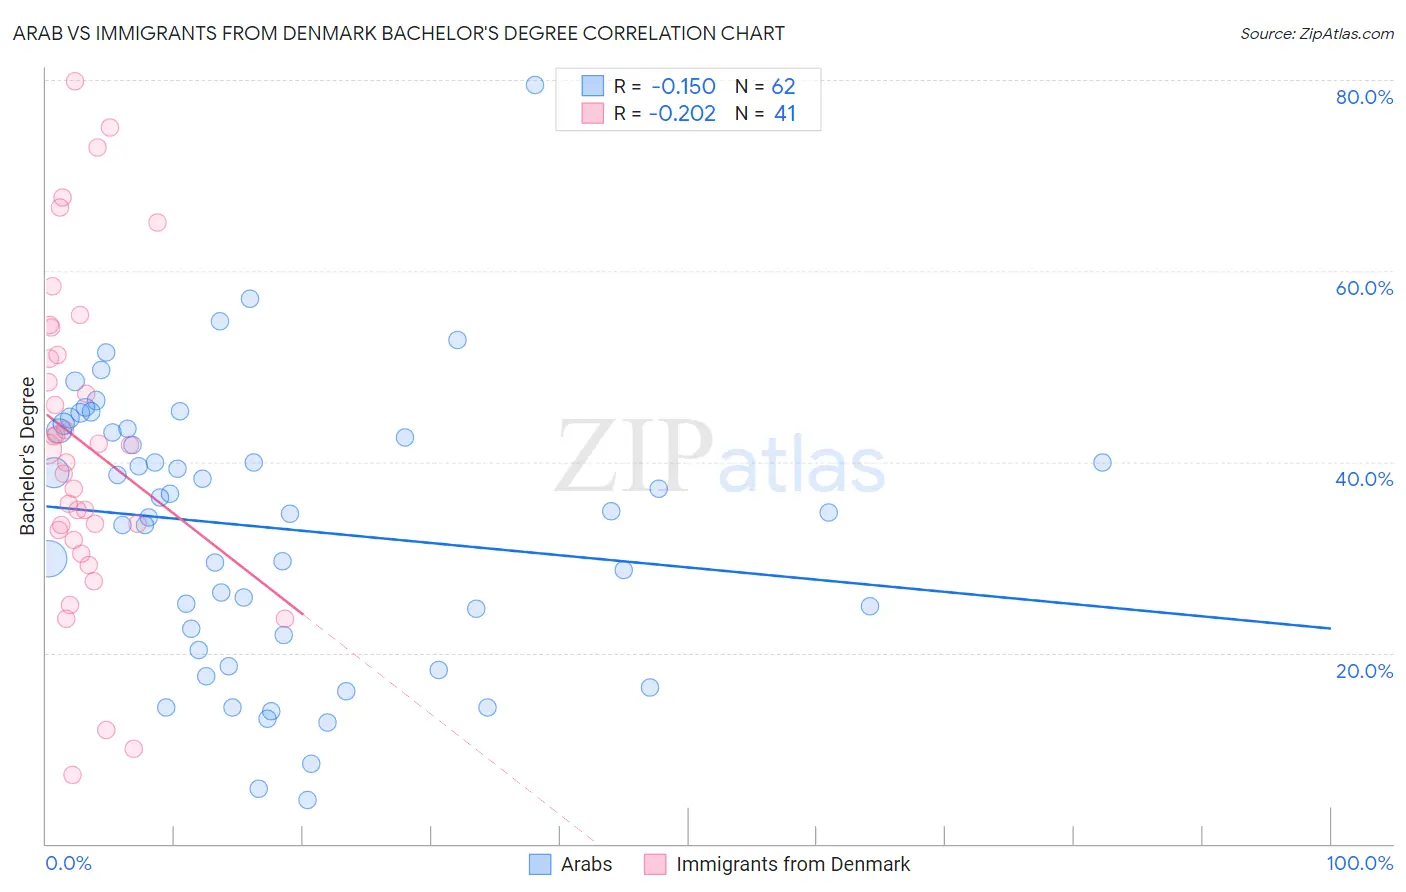
Arab vs Immigrants from Denmark Bachelor's Degree Correlation Chart
The statistical analysis conducted on geographies consisting of 486,810,717 people shows a poor negative correlation between the proportion of Arabs and percentage of population with at least bachelor's degree education in the United States with a correlation coefficient (R) of -0.150 and weighted average of 40.9%. Similarly, the statistical analysis conducted on geographies consisting of 136,428,731 people shows a weak negative correlation between the proportion of Immigrants from Denmark and percentage of population with at least bachelor's degree education in the United States with a correlation coefficient (R) of -0.202 and weighted average of 45.4%, a difference of 11.1%.
Bachelor's Degree Correlation Summary
| Measurement | Arab | Immigrants from Denmark |
| Minimum | 4.6% | 7.2% |
| Maximum | 79.5% | 79.9% |
| Range | 74.9% | 72.7% |
| Mean | 33.1% | 42.0% |
| Median | 34.8% | 41.3% |
| Interquartile 25% (IQ1) | 21.9% | 32.3% |
| Interquartile 75% (IQ3) | 43.2% | 52.7% |
| Interquartile Range (IQR) | 21.4% | 20.3% |
| Standard Deviation (Sample) | 14.4% | 16.9% |
| Standard Deviation (Population) | 14.3% | 16.7% |
Similar Demographics by Bachelor's Degree
Demographics Similar to Arabs by Bachelor's Degree
In terms of bachelor's degree, the demographic groups most similar to Arabs are Ukrainian (40.9%, a difference of 0.020%), Albanian (40.9%, a difference of 0.080%), Immigrants from Chile (40.8%, a difference of 0.12%), Northern European (41.0%, a difference of 0.16%), and Ugandan (40.8%, a difference of 0.17%).
| Demographics | Rating | Rank | Bachelor's Degree |
| Immigrants | Italy | 97.8 /100 | #102 | Exceptional 41.3% |
| Chileans | 97.5 /100 | #103 | Exceptional 41.2% |
| Jordanians | 97.4 /100 | #104 | Exceptional 41.2% |
| Syrians | 97.4 /100 | #105 | Exceptional 41.1% |
| Alsatians | 97.0 /100 | #106 | Exceptional 41.0% |
| Northern Europeans | 96.8 /100 | #107 | Exceptional 41.0% |
| Ukrainians | 96.6 /100 | #108 | Exceptional 40.9% |
| Arabs | 96.6 /100 | #109 | Exceptional 40.9% |
| Albanians | 96.5 /100 | #110 | Exceptional 40.9% |
| Immigrants | Chile | 96.4 /100 | #111 | Exceptional 40.8% |
| Ugandans | 96.3 /100 | #112 | Exceptional 40.8% |
| Brazilians | 96.3 /100 | #113 | Exceptional 40.8% |
| Afghans | 96.2 /100 | #114 | Exceptional 40.8% |
| Palestinians | 95.8 /100 | #115 | Exceptional 40.7% |
| Immigrants | Uganda | 95.7 /100 | #116 | Exceptional 40.7% |
Demographics Similar to Immigrants from Denmark by Bachelor's Degree
In terms of bachelor's degree, the demographic groups most similar to Immigrants from Denmark are Immigrants from Russia (45.4%, a difference of 0.030%), Mongolian (45.4%, a difference of 0.040%), Russian (45.3%, a difference of 0.19%), Bulgarian (45.3%, a difference of 0.28%), and Immigrants from Northern Europe (45.6%, a difference of 0.45%).
| Demographics | Rating | Rank | Bachelor's Degree |
| Immigrants | France | 100.0 /100 | #27 | Exceptional 46.4% |
| Turks | 100.0 /100 | #28 | Exceptional 46.2% |
| Israelis | 100.0 /100 | #29 | Exceptional 46.1% |
| Immigrants | Sri Lanka | 100.0 /100 | #30 | Exceptional 46.1% |
| Latvians | 100.0 /100 | #31 | Exceptional 46.1% |
| Immigrants | Turkey | 100.0 /100 | #32 | Exceptional 46.0% |
| Immigrants | Northern Europe | 100.0 /100 | #33 | Exceptional 45.6% |
| Immigrants | Denmark | 100.0 /100 | #34 | Exceptional 45.4% |
| Immigrants | Russia | 100.0 /100 | #35 | Exceptional 45.4% |
| Mongolians | 100.0 /100 | #36 | Exceptional 45.4% |
| Russians | 100.0 /100 | #37 | Exceptional 45.3% |
| Bulgarians | 100.0 /100 | #38 | Exceptional 45.3% |
| Immigrants | Latvia | 100.0 /100 | #39 | Exceptional 45.1% |
| Immigrants | Belarus | 100.0 /100 | #40 | Exceptional 45.0% |
| Immigrants | Malaysia | 100.0 /100 | #41 | Exceptional 45.0% |