Arab vs Cheyenne In Labor Force | Age 20-64
COMPARE
Arab
Cheyenne
In Labor Force | Age 20-64
In Labor Force | Age 20-64 Comparison
Arabs
Cheyenne
79.2%
IN LABOR FORCE | AGE 20-64
11.4/ 100
METRIC RATING
216th/ 347
METRIC RANK
74.8%
IN LABOR FORCE | AGE 20-64
0.0/ 100
METRIC RATING
329th/ 347
METRIC RANK
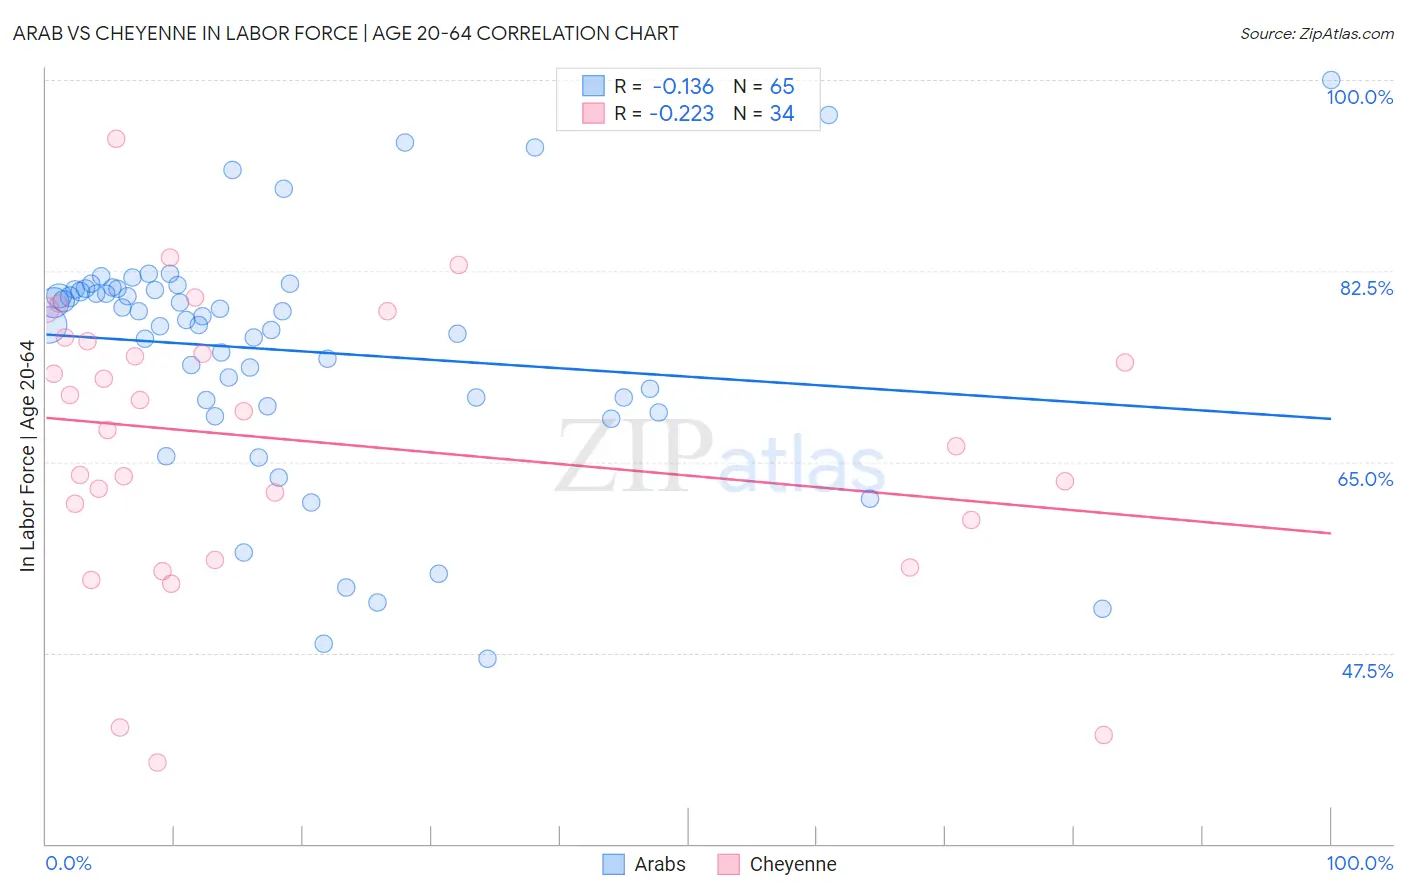
Arab vs Cheyenne In Labor Force | Age 20-64 Correlation Chart
The statistical analysis conducted on geographies consisting of 486,876,166 people shows a poor negative correlation between the proportion of Arabs and labor force participation rate among population between the ages 20 and 64 in the United States with a correlation coefficient (R) of -0.136 and weighted average of 79.2%. Similarly, the statistical analysis conducted on geographies consisting of 80,710,794 people shows a weak negative correlation between the proportion of Cheyenne and labor force participation rate among population between the ages 20 and 64 in the United States with a correlation coefficient (R) of -0.223 and weighted average of 74.8%, a difference of 5.9%.
In Labor Force | Age 20-64 Correlation Summary
| Measurement | Arab | Cheyenne |
| Minimum | 46.9% | 37.5% |
| Maximum | 100.0% | 94.6% |
| Range | 53.1% | 57.1% |
| Mean | 75.2% | 66.9% |
| Median | 78.0% | 68.8% |
| Interquartile 25% (IQ1) | 70.4% | 59.7% |
| Interquartile 75% (IQ3) | 80.8% | 76.1% |
| Interquartile Range (IQR) | 10.4% | 16.4% |
| Standard Deviation (Sample) | 11.1% | 13.0% |
| Standard Deviation (Population) | 11.0% | 12.8% |
Similar Demographics by In Labor Force | Age 20-64
Demographics Similar to Arabs by In Labor Force | Age 20-64
In terms of in labor force | age 20-64, the demographic groups most similar to Arabs are Immigrants from Armenia (79.2%, a difference of 0.010%), Immigrants from Norway (79.2%, a difference of 0.010%), Immigrants from Western Asia (79.2%, a difference of 0.010%), Irish (79.3%, a difference of 0.030%), and Immigrants from Portugal (79.3%, a difference of 0.030%).
| Demographics | Rating | Rank | In Labor Force | Age 20-64 |
| Bangladeshis | 16.4 /100 | #209 | Poor 79.3% |
| Haitians | 16.1 /100 | #210 | Poor 79.3% |
| Europeans | 15.3 /100 | #211 | Poor 79.3% |
| Irish | 13.2 /100 | #212 | Poor 79.3% |
| Immigrants | Portugal | 12.8 /100 | #213 | Poor 79.3% |
| Immigrants | Armenia | 12.2 /100 | #214 | Poor 79.2% |
| Immigrants | Norway | 12.0 /100 | #215 | Poor 79.2% |
| Arabs | 11.4 /100 | #216 | Poor 79.2% |
| Immigrants | Western Asia | 11.0 /100 | #217 | Poor 79.2% |
| Immigrants | England | 9.3 /100 | #218 | Tragic 79.2% |
| French Canadians | 8.4 /100 | #219 | Tragic 79.2% |
| Immigrants | Immigrants | 7.7 /100 | #220 | Tragic 79.2% |
| Hungarians | 7.2 /100 | #221 | Tragic 79.2% |
| Immigrants | Panama | 6.9 /100 | #222 | Tragic 79.1% |
| Canadians | 6.8 /100 | #223 | Tragic 79.1% |
Demographics Similar to Cheyenne by In Labor Force | Age 20-64
In terms of in labor force | age 20-64, the demographic groups most similar to Cheyenne are Colville (74.8%, a difference of 0.070%), Kiowa (75.0%, a difference of 0.20%), Paiute (74.7%, a difference of 0.20%), Sioux (75.0%, a difference of 0.23%), and Creek (75.1%, a difference of 0.40%).
| Demographics | Rating | Rank | In Labor Force | Age 20-64 |
| Dutch West Indians | 0.0 /100 | #322 | Tragic 75.5% |
| Cajuns | 0.0 /100 | #323 | Tragic 75.5% |
| Choctaw | 0.0 /100 | #324 | Tragic 75.4% |
| Menominee | 0.0 /100 | #325 | Tragic 75.3% |
| Creek | 0.0 /100 | #326 | Tragic 75.1% |
| Sioux | 0.0 /100 | #327 | Tragic 75.0% |
| Kiowa | 0.0 /100 | #328 | Tragic 75.0% |
| Cheyenne | 0.0 /100 | #329 | Tragic 74.8% |
| Colville | 0.0 /100 | #330 | Tragic 74.8% |
| Paiute | 0.0 /100 | #331 | Tragic 74.7% |
| Arapaho | 0.0 /100 | #332 | Tragic 74.4% |
| Natives/Alaskans | 0.0 /100 | #333 | Tragic 73.9% |
| Apache | 0.0 /100 | #334 | Tragic 73.7% |
| Ute | 0.0 /100 | #335 | Tragic 73.7% |
| Crow | 0.0 /100 | #336 | Tragic 73.3% |