Blackfeet vs Cheyenne Ambulatory Disability
COMPARE
Blackfeet
Cheyenne
Ambulatory Disability
Ambulatory Disability Comparison
Blackfeet
Cheyenne
7.1%
AMBULATORY DISABILITY
0.0/ 100
METRIC RATING
314th/ 347
METRIC RANK
6.9%
AMBULATORY DISABILITY
0.0/ 100
METRIC RATING
292nd/ 347
METRIC RANK
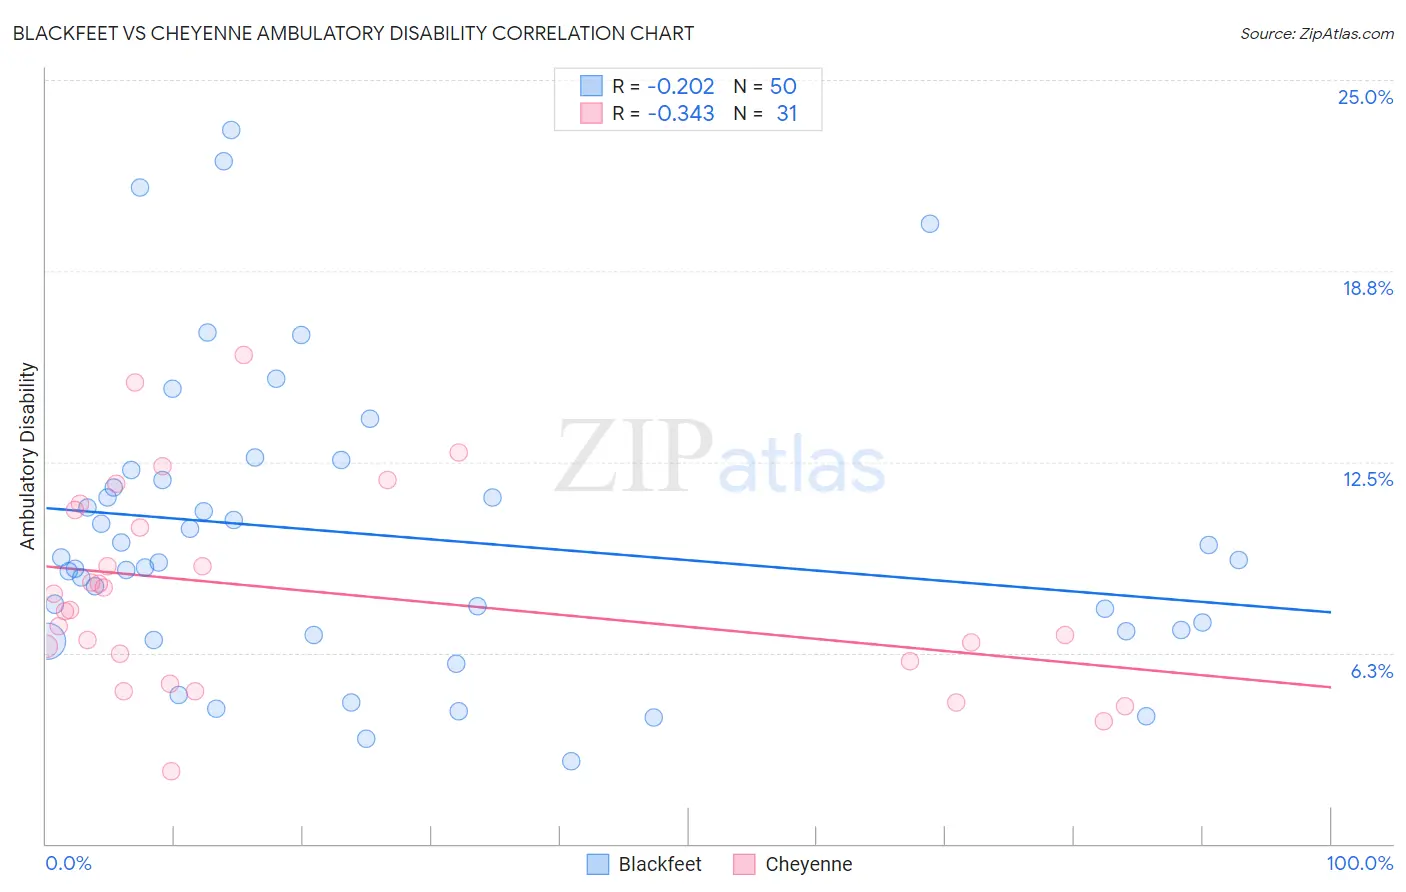
Blackfeet vs Cheyenne Ambulatory Disability Correlation Chart
The statistical analysis conducted on geographies consisting of 309,475,903 people shows a weak negative correlation between the proportion of Blackfeet and percentage of population with ambulatory disability in the United States with a correlation coefficient (R) of -0.202 and weighted average of 7.1%. Similarly, the statistical analysis conducted on geographies consisting of 80,709,712 people shows a mild negative correlation between the proportion of Cheyenne and percentage of population with ambulatory disability in the United States with a correlation coefficient (R) of -0.343 and weighted average of 6.9%, a difference of 3.7%.
Ambulatory Disability Correlation Summary
| Measurement | Blackfeet | Cheyenne |
| Minimum | 2.7% | 2.4% |
| Maximum | 23.4% | 16.0% |
| Range | 20.7% | 13.6% |
| Mean | 10.1% | 8.3% |
| Median | 9.2% | 7.7% |
| Interquartile 25% (IQ1) | 6.9% | 6.0% |
| Interquartile 75% (IQ3) | 11.9% | 10.9% |
| Interquartile Range (IQR) | 5.0% | 4.9% |
| Standard Deviation (Sample) | 4.8% | 3.3% |
| Standard Deviation (Population) | 4.8% | 3.2% |
Similar Demographics by Ambulatory Disability
Demographics Similar to Blackfeet by Ambulatory Disability
In terms of ambulatory disability, the demographic groups most similar to Blackfeet are Immigrants from Yemen (7.1%, a difference of 0.020%), Shoshone (7.1%, a difference of 0.020%), Delaware (7.1%, a difference of 0.15%), Immigrants from Dominican Republic (7.1%, a difference of 0.26%), and Central American Indian (7.2%, a difference of 0.34%).
| Demographics | Rating | Rank | Ambulatory Disability |
| Spanish Americans | 0.0 /100 | #307 | Tragic 7.1% |
| Chippewa | 0.0 /100 | #308 | Tragic 7.1% |
| Immigrants | Azores | 0.0 /100 | #309 | Tragic 7.1% |
| Arapaho | 0.0 /100 | #310 | Tragic 7.1% |
| Cree | 0.0 /100 | #311 | Tragic 7.1% |
| Delaware | 0.0 /100 | #312 | Tragic 7.1% |
| Immigrants | Yemen | 0.0 /100 | #313 | Tragic 7.1% |
| Blackfeet | 0.0 /100 | #314 | Tragic 7.1% |
| Shoshone | 0.0 /100 | #315 | Tragic 7.1% |
| Immigrants | Dominican Republic | 0.0 /100 | #316 | Tragic 7.1% |
| Central American Indians | 0.0 /100 | #317 | Tragic 7.2% |
| Ottawa | 0.0 /100 | #318 | Tragic 7.2% |
| Dominicans | 0.0 /100 | #319 | Tragic 7.2% |
| Potawatomi | 0.0 /100 | #320 | Tragic 7.3% |
| Apache | 0.0 /100 | #321 | Tragic 7.4% |
Demographics Similar to Cheyenne by Ambulatory Disability
In terms of ambulatory disability, the demographic groups most similar to Cheyenne are West Indian (6.9%, a difference of 0.060%), Scotch-Irish (6.9%, a difference of 0.16%), Immigrants from Dominica (6.9%, a difference of 0.19%), Immigrants from St. Vincent and the Grenadines (6.9%, a difference of 0.24%), and Nonimmigrants (6.9%, a difference of 0.33%).
| Demographics | Rating | Rank | Ambulatory Disability |
| Fijians | 0.0 /100 | #285 | Tragic 6.8% |
| Yakama | 0.0 /100 | #286 | Tragic 6.8% |
| U.S. Virgin Islanders | 0.0 /100 | #287 | Tragic 6.8% |
| Immigrants | Nonimmigrants | 0.0 /100 | #288 | Tragic 6.9% |
| Immigrants | Dominica | 0.0 /100 | #289 | Tragic 6.9% |
| Scotch-Irish | 0.0 /100 | #290 | Tragic 6.9% |
| West Indians | 0.0 /100 | #291 | Tragic 6.9% |
| Cheyenne | 0.0 /100 | #292 | Tragic 6.9% |
| Immigrants | St. Vincent and the Grenadines | 0.0 /100 | #293 | Tragic 6.9% |
| Cape Verdeans | 0.0 /100 | #294 | Tragic 6.9% |
| Crow | 0.0 /100 | #295 | Tragic 6.9% |
| Alaskan Athabascans | 0.0 /100 | #296 | Tragic 6.9% |
| French American Indians | 0.0 /100 | #297 | Tragic 6.9% |
| Immigrants | Grenada | 0.0 /100 | #298 | Tragic 6.9% |
| Puget Sound Salish | 0.0 /100 | #299 | Tragic 6.9% |