Apache vs Native/Alaskan Male Disability
COMPARE
Apache
Native/Alaskan
Male Disability
Male Disability Comparison
Apache
Natives/Alaskans
14.0%
MALE DISABILITY
0.0/ 100
METRIC RATING
322nd/ 347
METRIC RANK
14.2%
MALE DISABILITY
0.0/ 100
METRIC RATING
326th/ 347
METRIC RANK
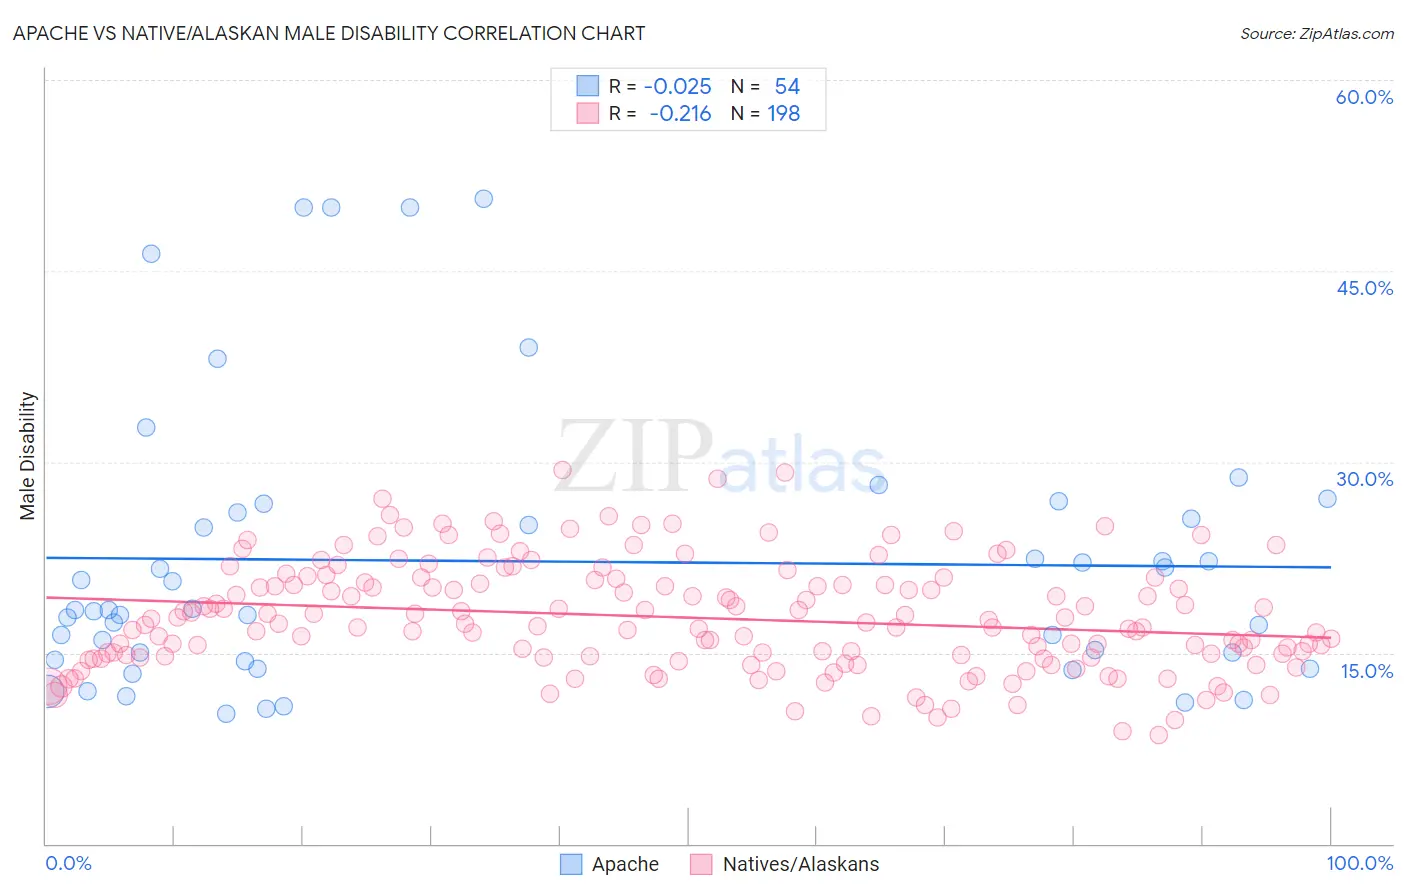
Apache vs Native/Alaskan Male Disability Correlation Chart
The statistical analysis conducted on geographies consisting of 231,062,399 people shows no correlation between the proportion of Apache and percentage of males with a disability in the United States with a correlation coefficient (R) of -0.025 and weighted average of 14.0%. Similarly, the statistical analysis conducted on geographies consisting of 512,854,069 people shows a weak negative correlation between the proportion of Natives/Alaskans and percentage of males with a disability in the United States with a correlation coefficient (R) of -0.216 and weighted average of 14.2%, a difference of 1.5%.
Male Disability Correlation Summary
| Measurement | Apache | Native/Alaskan |
| Minimum | 10.2% | 8.6% |
| Maximum | 50.7% | 29.4% |
| Range | 40.5% | 20.8% |
| Mean | 22.2% | 17.8% |
| Median | 18.3% | 17.3% |
| Interquartile 25% (IQ1) | 14.5% | 14.7% |
| Interquartile 75% (IQ3) | 26.0% | 20.5% |
| Interquartile Range (IQR) | 11.6% | 5.9% |
| Standard Deviation (Sample) | 11.0% | 4.3% |
| Standard Deviation (Population) | 10.9% | 4.3% |
Demographics Similar to Apache and Natives/Alaskans by Male Disability
In terms of male disability, the demographic groups most similar to Apache are Osage (14.0%, a difference of 0.070%), Comanche (14.1%, a difference of 0.40%), Ottawa (14.1%, a difference of 0.51%), Shoshone (13.8%, a difference of 1.1%), and Tlingit-Haida (13.8%, a difference of 1.2%). Similarly, the demographic groups most similar to Natives/Alaskans are Potawatomi (14.2%, a difference of 0.10%), Chippewa (14.3%, a difference of 0.53%), Ottawa (14.1%, a difference of 0.94%), Comanche (14.1%, a difference of 1.1%), and Cajun (14.4%, a difference of 1.1%).
| Demographics | Rating | Rank | Male Disability |
| Aleuts | 0.0 /100 | #314 | Tragic 13.5% |
| Iroquois | 0.0 /100 | #315 | Tragic 13.6% |
| Alaska Natives | 0.0 /100 | #316 | Tragic 13.6% |
| Paiute | 0.0 /100 | #317 | Tragic 13.7% |
| Cree | 0.0 /100 | #318 | Tragic 13.7% |
| Americans | 0.0 /100 | #319 | Tragic 13.8% |
| Tlingit-Haida | 0.0 /100 | #320 | Tragic 13.8% |
| Shoshone | 0.0 /100 | #321 | Tragic 13.8% |
| Apache | 0.0 /100 | #322 | Tragic 14.0% |
| Osage | 0.0 /100 | #323 | Tragic 14.0% |
| Comanche | 0.0 /100 | #324 | Tragic 14.1% |
| Ottawa | 0.0 /100 | #325 | Tragic 14.1% |
| Natives/Alaskans | 0.0 /100 | #326 | Tragic 14.2% |
| Potawatomi | 0.0 /100 | #327 | Tragic 14.2% |
| Chippewa | 0.0 /100 | #328 | Tragic 14.3% |
| Cajuns | 0.0 /100 | #329 | Tragic 14.4% |
| Navajo | 0.0 /100 | #330 | Tragic 14.4% |
| Tohono O'odham | 0.0 /100 | #331 | Tragic 14.6% |
| Seminole | 0.0 /100 | #332 | Tragic 14.7% |
| Yuman | 0.0 /100 | #333 | Tragic 14.7% |
| Cherokee | 0.0 /100 | #334 | Tragic 14.8% |