Alsatian vs Immigrants from Bosnia and Herzegovina Disability Age Under 5
COMPARE
Alsatian
Immigrants from Bosnia and Herzegovina
Disability Age Under 5
Disability Age Under 5 Comparison
Alsatians
Immigrants from Bosnia and Herzegovina
1.2%
DISABILITY AGE UNDER 5
79.3/ 100
METRIC RATING
143rd/ 347
METRIC RANK
1.3%
DISABILITY AGE UNDER 5
36.5/ 100
METRIC RATING
192nd/ 347
METRIC RANK
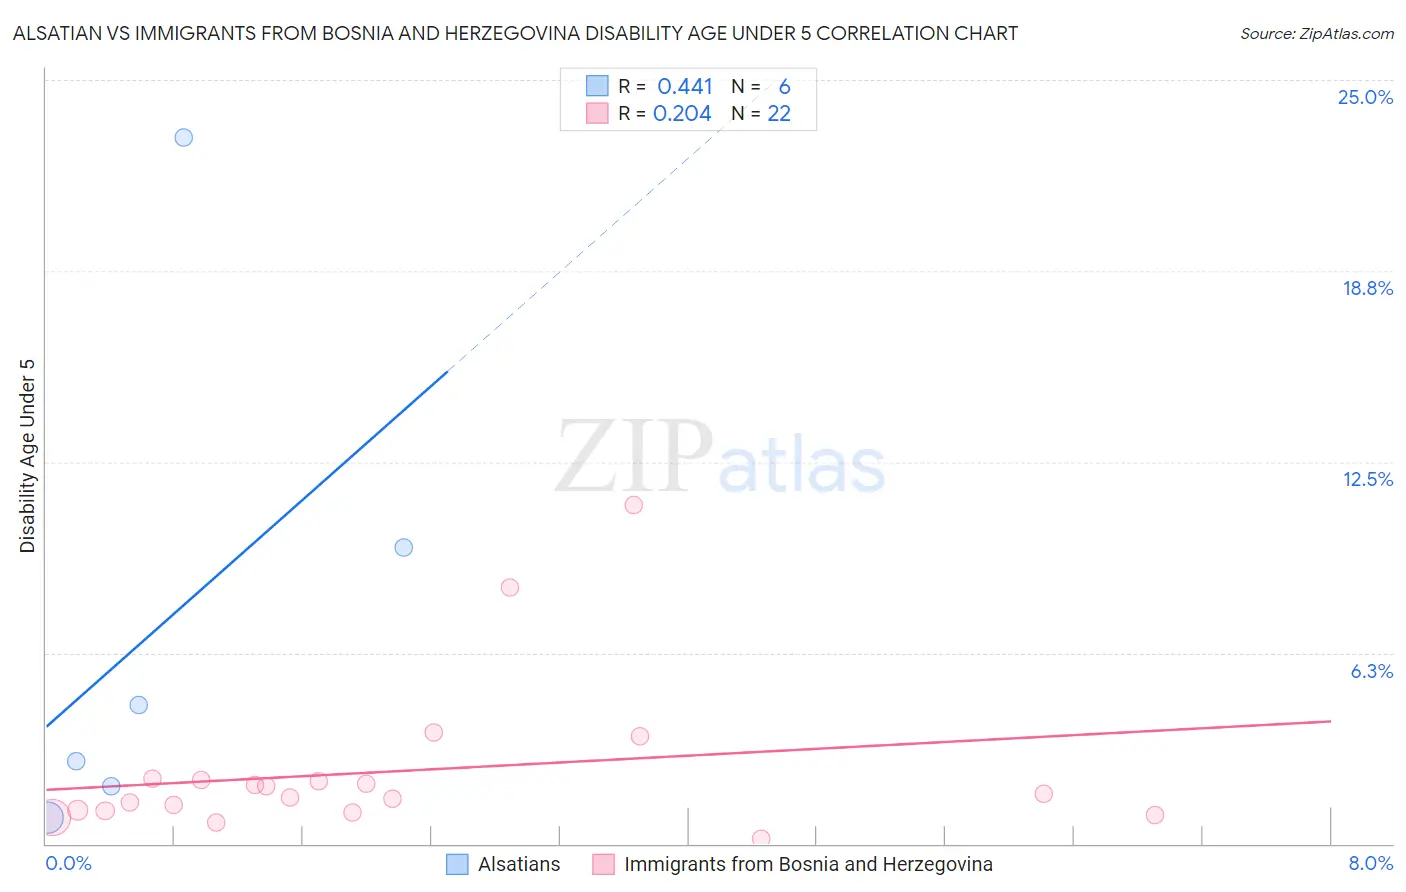
Alsatian vs Immigrants from Bosnia and Herzegovina Disability Age Under 5 Correlation Chart
The statistical analysis conducted on geographies consisting of 65,109,236 people shows a moderate positive correlation between the proportion of Alsatians and percentage of population with a disability under the age of 5 in the United States with a correlation coefficient (R) of 0.441 and weighted average of 1.2%. Similarly, the statistical analysis conducted on geographies consisting of 106,812,268 people shows a weak positive correlation between the proportion of Immigrants from Bosnia and Herzegovina and percentage of population with a disability under the age of 5 in the United States with a correlation coefficient (R) of 0.204 and weighted average of 1.3%, a difference of 4.4%.
Disability Age Under 5 Correlation Summary
| Measurement | Alsatian | Immigrants from Bosnia and Herzegovina |
| Minimum | 0.86% | 0.18% |
| Maximum | 23.1% | 11.1% |
| Range | 22.3% | 10.9% |
| Mean | 7.1% | 2.4% |
| Median | 3.6% | 1.6% |
| Interquartile 25% (IQ1) | 1.9% | 1.1% |
| Interquartile 75% (IQ3) | 9.7% | 2.1% |
| Interquartile Range (IQR) | 7.8% | 1.0% |
| Standard Deviation (Sample) | 8.4% | 2.6% |
| Standard Deviation (Population) | 7.7% | 2.5% |
Similar Demographics by Disability Age Under 5
Demographics Similar to Alsatians by Disability Age Under 5
In terms of disability age under 5, the demographic groups most similar to Alsatians are Immigrants from Middle Africa (1.2%, a difference of 0.0%), Immigrants from Colombia (1.2%, a difference of 0.010%), Immigrants from Honduras (1.2%, a difference of 0.16%), Immigrants from Zimbabwe (1.2%, a difference of 0.19%), and Somali (1.2%, a difference of 0.22%).
| Demographics | Rating | Rank | Disability Age Under 5 |
| Moroccans | 83.6 /100 | #136 | Excellent 1.2% |
| Immigrants | Eastern Africa | 83.1 /100 | #137 | Excellent 1.2% |
| Immigrants | Czechoslovakia | 82.8 /100 | #138 | Excellent 1.2% |
| New Zealanders | 81.4 /100 | #139 | Excellent 1.2% |
| Somalis | 80.8 /100 | #140 | Excellent 1.2% |
| Immigrants | Honduras | 80.4 /100 | #141 | Excellent 1.2% |
| Immigrants | Colombia | 79.3 /100 | #142 | Good 1.2% |
| Alsatians | 79.3 /100 | #143 | Good 1.2% |
| Immigrants | Middle Africa | 79.3 /100 | #144 | Good 1.2% |
| Immigrants | Zimbabwe | 77.9 /100 | #145 | Good 1.2% |
| Samoans | 77.7 /100 | #146 | Good 1.2% |
| Icelanders | 76.3 /100 | #147 | Good 1.2% |
| Ghanaians | 76.3 /100 | #148 | Good 1.2% |
| Kenyans | 75.9 /100 | #149 | Good 1.2% |
| South Americans | 75.6 /100 | #150 | Good 1.2% |
Demographics Similar to Immigrants from Bosnia and Herzegovina by Disability Age Under 5
In terms of disability age under 5, the demographic groups most similar to Immigrants from Bosnia and Herzegovina are Mexican American Indian (1.3%, a difference of 0.0%), Immigrants from Sierra Leone (1.3%, a difference of 0.0%), Immigrants from Laos (1.3%, a difference of 0.010%), Peruvian (1.3%, a difference of 0.10%), and Immigrants from North Macedonia (1.3%, a difference of 0.18%).
| Demographics | Rating | Rank | Disability Age Under 5 |
| Immigrants | Western Africa | 42.5 /100 | #185 | Average 1.2% |
| Cubans | 42.5 /100 | #186 | Average 1.2% |
| Immigrants | Haiti | 40.2 /100 | #187 | Average 1.3% |
| Haitians | 39.9 /100 | #188 | Fair 1.3% |
| Peruvians | 37.6 /100 | #189 | Fair 1.3% |
| Immigrants | Laos | 36.6 /100 | #190 | Fair 1.3% |
| Mexican American Indians | 36.6 /100 | #191 | Fair 1.3% |
| Immigrants | Bosnia and Herzegovina | 36.5 /100 | #192 | Fair 1.3% |
| Immigrants | Sierra Leone | 36.5 /100 | #193 | Fair 1.3% |
| Immigrants | North Macedonia | 34.7 /100 | #194 | Fair 1.3% |
| U.S. Virgin Islanders | 34.4 /100 | #195 | Fair 1.3% |
| Immigrants | Belgium | 31.4 /100 | #196 | Fair 1.3% |
| Immigrants | Somalia | 31.3 /100 | #197 | Fair 1.3% |
| Immigrants | Norway | 31.1 /100 | #198 | Fair 1.3% |
| Jamaicans | 30.7 /100 | #199 | Fair 1.3% |