Immigrants from Congo vs Immigrants from Bosnia and Herzegovina Disability Age Under 5
COMPARE
Immigrants from Congo
Immigrants from Bosnia and Herzegovina
Disability Age Under 5
Disability Age Under 5 Comparison
Immigrants from Congo
Immigrants from Bosnia and Herzegovina
1.1%
DISABILITY AGE UNDER 5
99.8/ 100
METRIC RATING
46th/ 347
METRIC RANK
1.3%
DISABILITY AGE UNDER 5
36.5/ 100
METRIC RATING
192nd/ 347
METRIC RANK
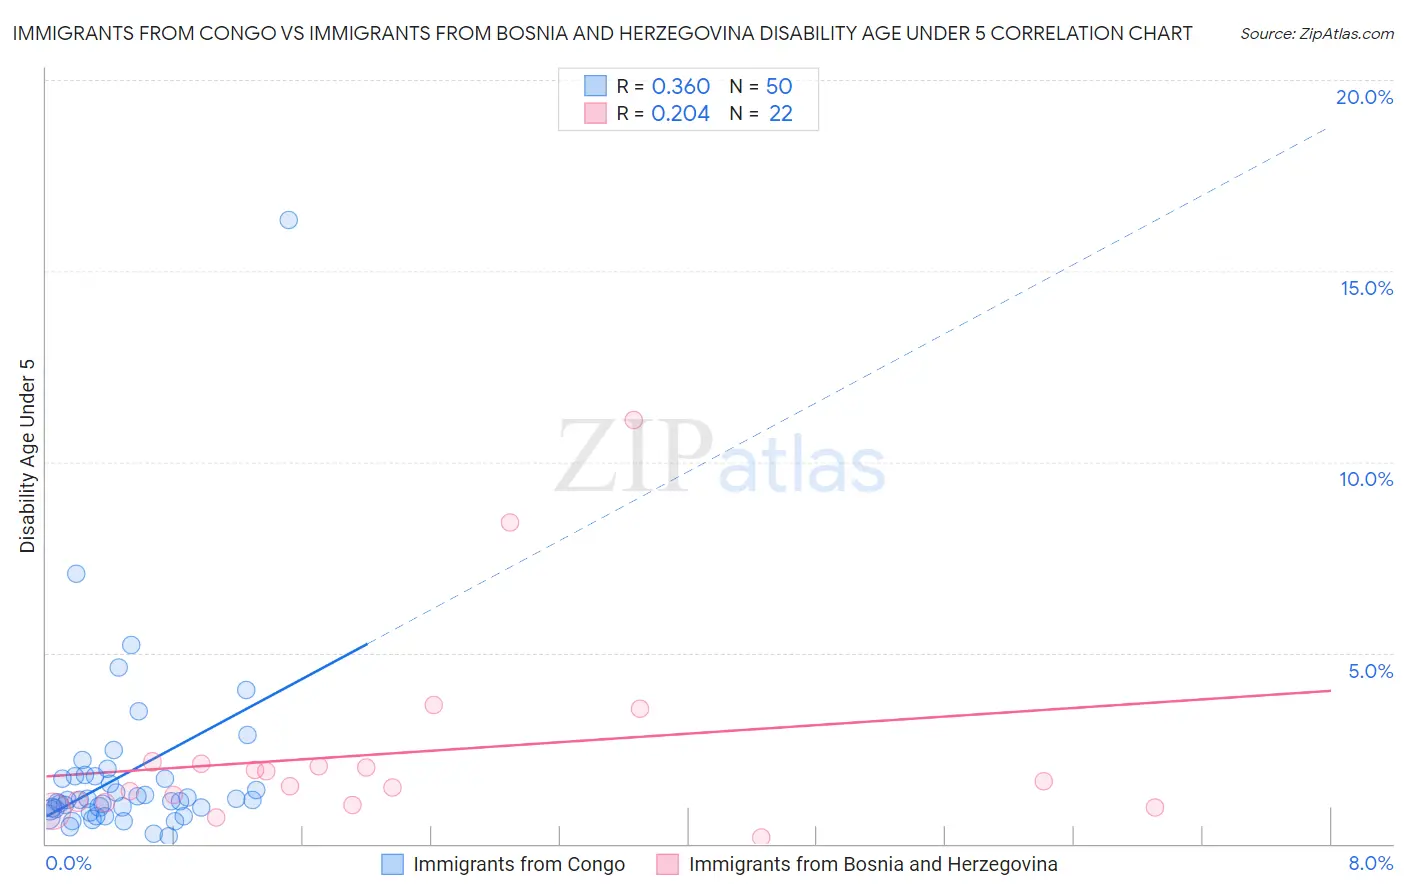
Immigrants from Congo vs Immigrants from Bosnia and Herzegovina Disability Age Under 5 Correlation Chart
The statistical analysis conducted on geographies consisting of 74,886,449 people shows a mild positive correlation between the proportion of Immigrants from Congo and percentage of population with a disability under the age of 5 in the United States with a correlation coefficient (R) of 0.360 and weighted average of 1.1%. Similarly, the statistical analysis conducted on geographies consisting of 106,812,268 people shows a weak positive correlation between the proportion of Immigrants from Bosnia and Herzegovina and percentage of population with a disability under the age of 5 in the United States with a correlation coefficient (R) of 0.204 and weighted average of 1.3%, a difference of 17.4%.
Disability Age Under 5 Correlation Summary
| Measurement | Immigrants from Congo | Immigrants from Bosnia and Herzegovina |
| Minimum | 0.19% | 0.18% |
| Maximum | 16.3% | 11.1% |
| Range | 16.1% | 10.9% |
| Mean | 1.8% | 2.4% |
| Median | 1.2% | 1.6% |
| Interquartile 25% (IQ1) | 0.89% | 1.1% |
| Interquartile 75% (IQ3) | 1.8% | 2.1% |
| Interquartile Range (IQR) | 0.87% | 1.0% |
| Standard Deviation (Sample) | 2.5% | 2.6% |
| Standard Deviation (Population) | 2.4% | 2.5% |
Similar Demographics by Disability Age Under 5
Demographics Similar to Immigrants from Congo by Disability Age Under 5
In terms of disability age under 5, the demographic groups most similar to Immigrants from Congo are Immigrants from Sweden (1.1%, a difference of 0.14%), Immigrants from Singapore (1.1%, a difference of 0.36%), Immigrants from Turkey (1.1%, a difference of 0.40%), Immigrants from Russia (1.1%, a difference of 0.57%), and Immigrants from Japan (1.1%, a difference of 0.58%).
| Demographics | Rating | Rank | Disability Age Under 5 |
| Filipinos | 99.9 /100 | #39 | Exceptional 1.1% |
| Immigrants | Albania | 99.9 /100 | #40 | Exceptional 1.1% |
| Thais | 99.8 /100 | #41 | Exceptional 1.1% |
| Immigrants | Bulgaria | 99.8 /100 | #42 | Exceptional 1.1% |
| Pima | 99.8 /100 | #43 | Exceptional 1.1% |
| Immigrants | Asia | 99.8 /100 | #44 | Exceptional 1.1% |
| Immigrants | Turkey | 99.8 /100 | #45 | Exceptional 1.1% |
| Immigrants | Congo | 99.8 /100 | #46 | Exceptional 1.1% |
| Immigrants | Sweden | 99.8 /100 | #47 | Exceptional 1.1% |
| Immigrants | Singapore | 99.7 /100 | #48 | Exceptional 1.1% |
| Immigrants | Russia | 99.7 /100 | #49 | Exceptional 1.1% |
| Immigrants | Japan | 99.7 /100 | #50 | Exceptional 1.1% |
| Immigrants | Kazakhstan | 99.7 /100 | #51 | Exceptional 1.1% |
| Immigrants | Bolivia | 99.6 /100 | #52 | Exceptional 1.1% |
| Asians | 99.6 /100 | #53 | Exceptional 1.1% |
Demographics Similar to Immigrants from Bosnia and Herzegovina by Disability Age Under 5
In terms of disability age under 5, the demographic groups most similar to Immigrants from Bosnia and Herzegovina are Mexican American Indian (1.3%, a difference of 0.0%), Immigrants from Sierra Leone (1.3%, a difference of 0.0%), Immigrants from Laos (1.3%, a difference of 0.010%), Peruvian (1.3%, a difference of 0.10%), and Immigrants from North Macedonia (1.3%, a difference of 0.18%).
| Demographics | Rating | Rank | Disability Age Under 5 |
| Immigrants | Western Africa | 42.5 /100 | #185 | Average 1.2% |
| Cubans | 42.5 /100 | #186 | Average 1.2% |
| Immigrants | Haiti | 40.2 /100 | #187 | Average 1.3% |
| Haitians | 39.9 /100 | #188 | Fair 1.3% |
| Peruvians | 37.6 /100 | #189 | Fair 1.3% |
| Immigrants | Laos | 36.6 /100 | #190 | Fair 1.3% |
| Mexican American Indians | 36.6 /100 | #191 | Fair 1.3% |
| Immigrants | Bosnia and Herzegovina | 36.5 /100 | #192 | Fair 1.3% |
| Immigrants | Sierra Leone | 36.5 /100 | #193 | Fair 1.3% |
| Immigrants | North Macedonia | 34.7 /100 | #194 | Fair 1.3% |
| U.S. Virgin Islanders | 34.4 /100 | #195 | Fair 1.3% |
| Immigrants | Belgium | 31.4 /100 | #196 | Fair 1.3% |
| Immigrants | Somalia | 31.3 /100 | #197 | Fair 1.3% |
| Immigrants | Norway | 31.1 /100 | #198 | Fair 1.3% |
| Jamaicans | 30.7 /100 | #199 | Fair 1.3% |