Egyptian vs Immigrants from Bosnia and Herzegovina Disability Age Under 5
COMPARE
Egyptian
Immigrants from Bosnia and Herzegovina
Disability Age Under 5
Disability Age Under 5 Comparison
Egyptians
Immigrants from Bosnia and Herzegovina
1.1%
DISABILITY AGE UNDER 5
98.9/ 100
METRIC RATING
64th/ 347
METRIC RANK
1.3%
DISABILITY AGE UNDER 5
36.5/ 100
METRIC RATING
192nd/ 347
METRIC RANK
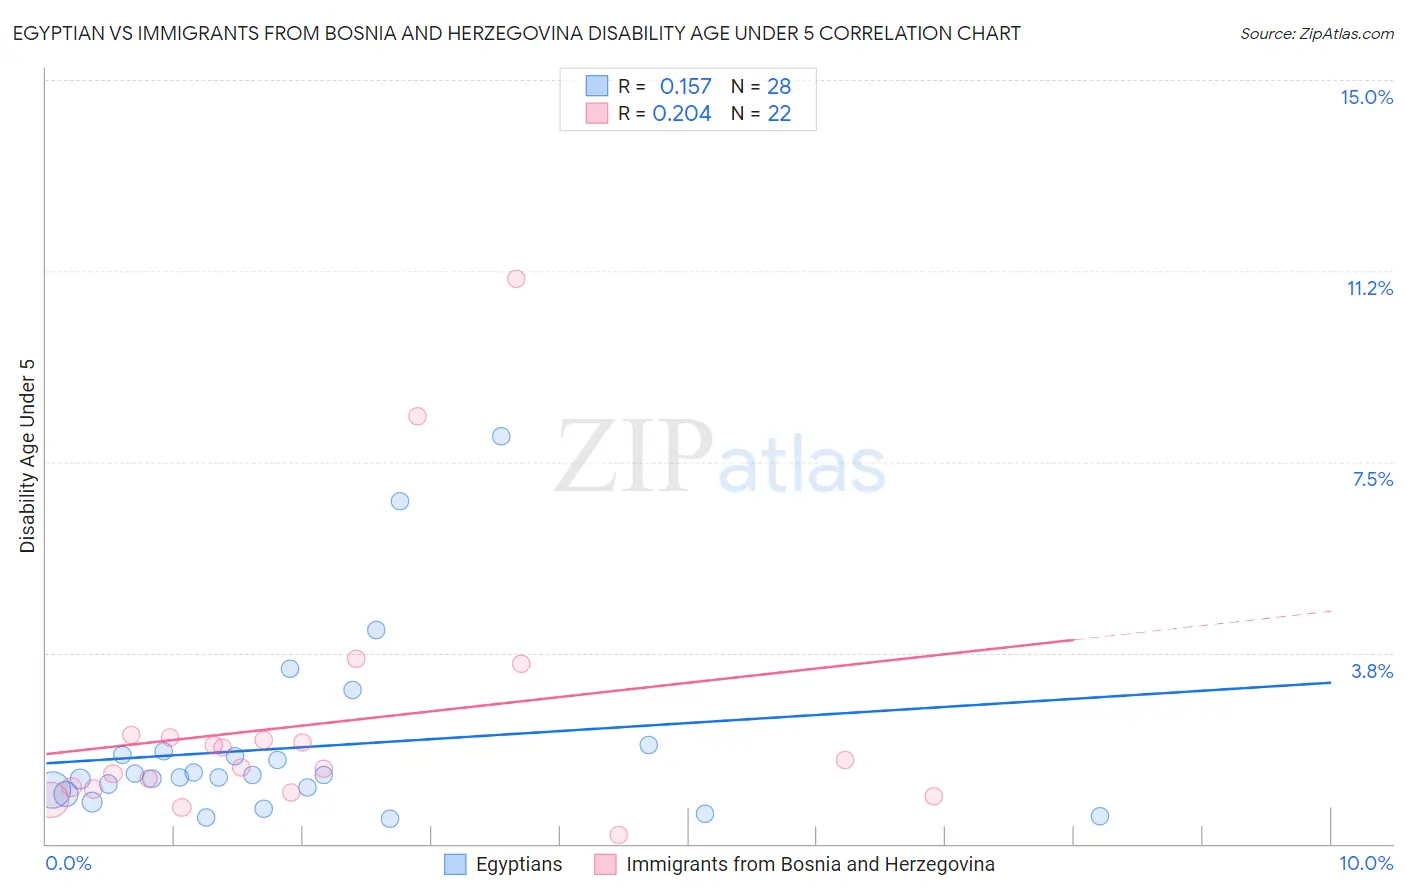
Egyptian vs Immigrants from Bosnia and Herzegovina Disability Age Under 5 Correlation Chart
The statistical analysis conducted on geographies consisting of 167,621,034 people shows a poor positive correlation between the proportion of Egyptians and percentage of population with a disability under the age of 5 in the United States with a correlation coefficient (R) of 0.157 and weighted average of 1.1%. Similarly, the statistical analysis conducted on geographies consisting of 106,812,268 people shows a weak positive correlation between the proportion of Immigrants from Bosnia and Herzegovina and percentage of population with a disability under the age of 5 in the United States with a correlation coefficient (R) of 0.204 and weighted average of 1.3%, a difference of 12.8%.
Disability Age Under 5 Correlation Summary
| Measurement | Egyptian | Immigrants from Bosnia and Herzegovina |
| Minimum | 0.49% | 0.18% |
| Maximum | 8.0% | 11.1% |
| Range | 7.5% | 10.9% |
| Mean | 1.9% | 2.4% |
| Median | 1.3% | 1.6% |
| Interquartile 25% (IQ1) | 1.0% | 1.1% |
| Interquartile 75% (IQ3) | 1.8% | 2.1% |
| Interquartile Range (IQR) | 0.77% | 1.0% |
| Standard Deviation (Sample) | 1.8% | 2.6% |
| Standard Deviation (Population) | 1.7% | 2.5% |
Similar Demographics by Disability Age Under 5
Demographics Similar to Egyptians by Disability Age Under 5
In terms of disability age under 5, the demographic groups most similar to Egyptians are Immigrants from Korea (1.1%, a difference of 0.34%), Immigrants from Vietnam (1.1%, a difference of 0.46%), Immigrants from Indonesia (1.1%, a difference of 0.46%), Immigrants from Belize (1.1%, a difference of 0.53%), and Immigrants from Switzerland (1.1%, a difference of 0.57%).
| Demographics | Rating | Rank | Disability Age Under 5 |
| Assyrians/Chaldeans/Syriacs | 99.5 /100 | #57 | Exceptional 1.1% |
| Immigrants | Egypt | 99.4 /100 | #58 | Exceptional 1.1% |
| Immigrants | Malaysia | 99.4 /100 | #59 | Exceptional 1.1% |
| Immigrants | Western Asia | 99.2 /100 | #60 | Exceptional 1.1% |
| Immigrants | Ethiopia | 99.2 /100 | #61 | Exceptional 1.1% |
| Immigrants | Switzerland | 99.2 /100 | #62 | Exceptional 1.1% |
| Immigrants | Vietnam | 99.1 /100 | #63 | Exceptional 1.1% |
| Egyptians | 98.9 /100 | #64 | Exceptional 1.1% |
| Immigrants | Korea | 98.8 /100 | #65 | Exceptional 1.1% |
| Immigrants | Indonesia | 98.7 /100 | #66 | Exceptional 1.1% |
| Immigrants | Belize | 98.7 /100 | #67 | Exceptional 1.1% |
| South Africans | 98.7 /100 | #68 | Exceptional 1.1% |
| Israelis | 98.7 /100 | #69 | Exceptional 1.1% |
| Immigrants | Ecuador | 98.6 /100 | #70 | Exceptional 1.1% |
| Trinidadians and Tobagonians | 98.6 /100 | #71 | Exceptional 1.1% |
Demographics Similar to Immigrants from Bosnia and Herzegovina by Disability Age Under 5
In terms of disability age under 5, the demographic groups most similar to Immigrants from Bosnia and Herzegovina are Mexican American Indian (1.3%, a difference of 0.0%), Immigrants from Sierra Leone (1.3%, a difference of 0.0%), Immigrants from Laos (1.3%, a difference of 0.010%), Peruvian (1.3%, a difference of 0.10%), and Immigrants from North Macedonia (1.3%, a difference of 0.18%).
| Demographics | Rating | Rank | Disability Age Under 5 |
| Immigrants | Western Africa | 42.5 /100 | #185 | Average 1.2% |
| Cubans | 42.5 /100 | #186 | Average 1.2% |
| Immigrants | Haiti | 40.2 /100 | #187 | Average 1.3% |
| Haitians | 39.9 /100 | #188 | Fair 1.3% |
| Peruvians | 37.6 /100 | #189 | Fair 1.3% |
| Immigrants | Laos | 36.6 /100 | #190 | Fair 1.3% |
| Mexican American Indians | 36.6 /100 | #191 | Fair 1.3% |
| Immigrants | Bosnia and Herzegovina | 36.5 /100 | #192 | Fair 1.3% |
| Immigrants | Sierra Leone | 36.5 /100 | #193 | Fair 1.3% |
| Immigrants | North Macedonia | 34.7 /100 | #194 | Fair 1.3% |
| U.S. Virgin Islanders | 34.4 /100 | #195 | Fair 1.3% |
| Immigrants | Belgium | 31.4 /100 | #196 | Fair 1.3% |
| Immigrants | Somalia | 31.3 /100 | #197 | Fair 1.3% |
| Immigrants | Norway | 31.1 /100 | #198 | Fair 1.3% |
| Jamaicans | 30.7 /100 | #199 | Fair 1.3% |