Alsatian vs Immigrants from Syria Disability Age Under 5
COMPARE
Alsatian
Immigrants from Syria
Disability Age Under 5
Disability Age Under 5 Comparison
Alsatians
Immigrants from Syria
1.2%
DISABILITY AGE UNDER 5
79.3/ 100
METRIC RATING
143rd/ 347
METRIC RANK
1.1%
DISABILITY AGE UNDER 5
97.9/ 100
METRIC RATING
83rd/ 347
METRIC RANK
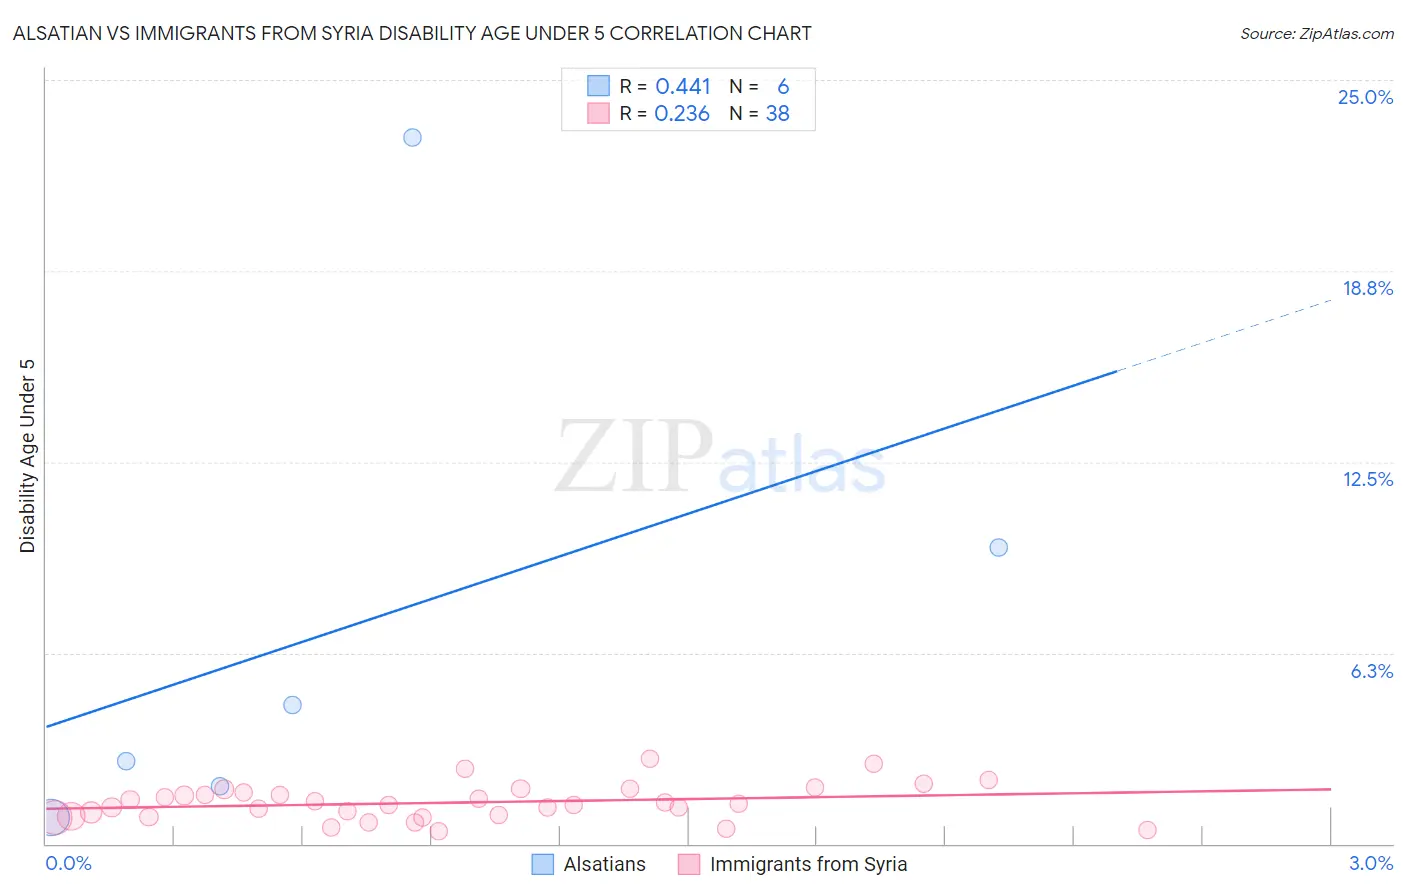
Alsatian vs Immigrants from Syria Disability Age Under 5 Correlation Chart
The statistical analysis conducted on geographies consisting of 65,109,236 people shows a moderate positive correlation between the proportion of Alsatians and percentage of population with a disability under the age of 5 in the United States with a correlation coefficient (R) of 0.441 and weighted average of 1.2%. Similarly, the statistical analysis conducted on geographies consisting of 121,605,651 people shows a weak positive correlation between the proportion of Immigrants from Syria and percentage of population with a disability under the age of 5 in the United States with a correlation coefficient (R) of 0.236 and weighted average of 1.1%, a difference of 6.2%.
Disability Age Under 5 Correlation Summary
| Measurement | Alsatian | Immigrants from Syria |
| Minimum | 0.86% | 0.39% |
| Maximum | 23.1% | 2.8% |
| Range | 22.3% | 2.4% |
| Mean | 7.1% | 1.3% |
| Median | 3.6% | 1.3% |
| Interquartile 25% (IQ1) | 1.9% | 0.88% |
| Interquartile 75% (IQ3) | 9.7% | 1.7% |
| Interquartile Range (IQR) | 7.8% | 0.81% |
| Standard Deviation (Sample) | 8.4% | 0.58% |
| Standard Deviation (Population) | 7.7% | 0.57% |
Similar Demographics by Disability Age Under 5
Demographics Similar to Alsatians by Disability Age Under 5
In terms of disability age under 5, the demographic groups most similar to Alsatians are Immigrants from Middle Africa (1.2%, a difference of 0.0%), Immigrants from Colombia (1.2%, a difference of 0.010%), Immigrants from Honduras (1.2%, a difference of 0.16%), Immigrants from Zimbabwe (1.2%, a difference of 0.19%), and Somali (1.2%, a difference of 0.22%).
| Demographics | Rating | Rank | Disability Age Under 5 |
| Moroccans | 83.6 /100 | #136 | Excellent 1.2% |
| Immigrants | Eastern Africa | 83.1 /100 | #137 | Excellent 1.2% |
| Immigrants | Czechoslovakia | 82.8 /100 | #138 | Excellent 1.2% |
| New Zealanders | 81.4 /100 | #139 | Excellent 1.2% |
| Somalis | 80.8 /100 | #140 | Excellent 1.2% |
| Immigrants | Honduras | 80.4 /100 | #141 | Excellent 1.2% |
| Immigrants | Colombia | 79.3 /100 | #142 | Good 1.2% |
| Alsatians | 79.3 /100 | #143 | Good 1.2% |
| Immigrants | Middle Africa | 79.3 /100 | #144 | Good 1.2% |
| Immigrants | Zimbabwe | 77.9 /100 | #145 | Good 1.2% |
| Samoans | 77.7 /100 | #146 | Good 1.2% |
| Icelanders | 76.3 /100 | #147 | Good 1.2% |
| Ghanaians | 76.3 /100 | #148 | Good 1.2% |
| Kenyans | 75.9 /100 | #149 | Good 1.2% |
| South Americans | 75.6 /100 | #150 | Good 1.2% |
Demographics Similar to Immigrants from Syria by Disability Age Under 5
In terms of disability age under 5, the demographic groups most similar to Immigrants from Syria are Immigrants from Jordan (1.1%, a difference of 0.010%), Turkish (1.1%, a difference of 0.12%), Immigrants from Trinidad and Tobago (1.1%, a difference of 0.14%), Immigrants from Zaire (1.1%, a difference of 0.15%), and Hmong (1.1%, a difference of 0.16%).
| Demographics | Rating | Rank | Disability Age Under 5 |
| Immigrants | Burma/Myanmar | 98.2 /100 | #76 | Exceptional 1.1% |
| Immigrants | Denmark | 98.1 /100 | #77 | Exceptional 1.1% |
| West Indians | 98.0 /100 | #78 | Exceptional 1.1% |
| Hmong | 98.0 /100 | #79 | Exceptional 1.1% |
| Immigrants | Trinidad and Tobago | 98.0 /100 | #80 | Exceptional 1.1% |
| Turks | 98.0 /100 | #81 | Exceptional 1.1% |
| Immigrants | Jordan | 97.9 /100 | #82 | Exceptional 1.1% |
| Immigrants | Syria | 97.9 /100 | #83 | Exceptional 1.1% |
| Immigrants | Zaire | 97.8 /100 | #84 | Exceptional 1.1% |
| Sudanese | 97.7 /100 | #85 | Exceptional 1.1% |
| Okinawans | 97.6 /100 | #86 | Exceptional 1.1% |
| Ugandans | 97.5 /100 | #87 | Exceptional 1.1% |
| Immigrants | Dominican Republic | 97.5 /100 | #88 | Exceptional 1.1% |
| Ethiopians | 97.2 /100 | #89 | Exceptional 1.1% |
| Chinese | 97.2 /100 | #90 | Exceptional 1.1% |