Sri Lankan vs Immigrants from Bosnia and Herzegovina Disability Age Under 5
COMPARE
Sri Lankan
Immigrants from Bosnia and Herzegovina
Disability Age Under 5
Disability Age Under 5 Comparison
Sri Lankans
Immigrants from Bosnia and Herzegovina
1.1%
DISABILITY AGE UNDER 5
96.8/ 100
METRIC RATING
94th/ 347
METRIC RANK
1.3%
DISABILITY AGE UNDER 5
36.5/ 100
METRIC RATING
192nd/ 347
METRIC RANK
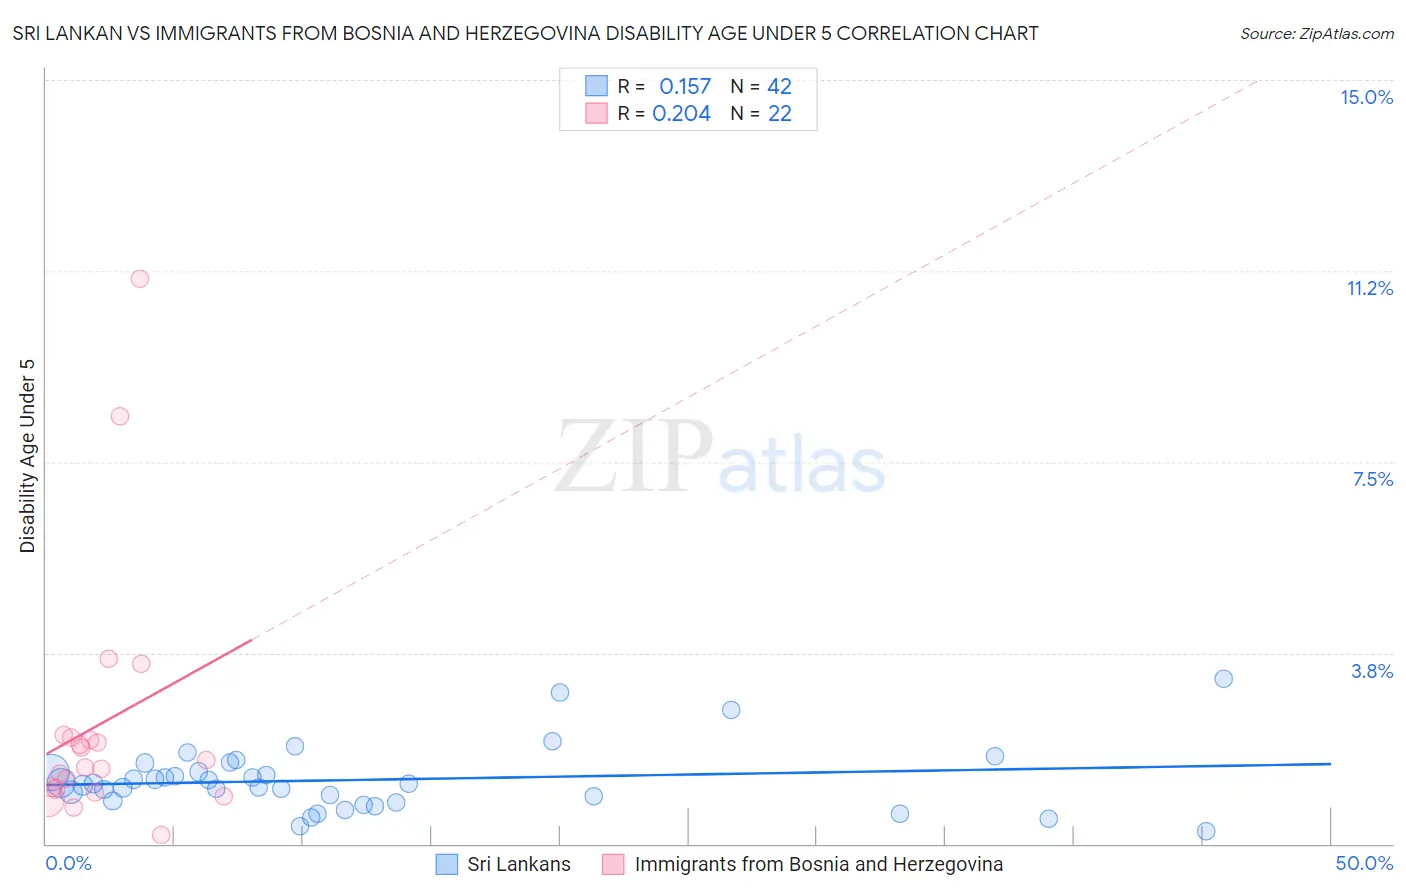
Sri Lankan vs Immigrants from Bosnia and Herzegovina Disability Age Under 5 Correlation Chart
The statistical analysis conducted on geographies consisting of 232,959,648 people shows a poor positive correlation between the proportion of Sri Lankans and percentage of population with a disability under the age of 5 in the United States with a correlation coefficient (R) of 0.157 and weighted average of 1.1%. Similarly, the statistical analysis conducted on geographies consisting of 106,812,268 people shows a weak positive correlation between the proportion of Immigrants from Bosnia and Herzegovina and percentage of population with a disability under the age of 5 in the United States with a correlation coefficient (R) of 0.204 and weighted average of 1.3%, a difference of 9.8%.
Disability Age Under 5 Correlation Summary
| Measurement | Sri Lankan | Immigrants from Bosnia and Herzegovina |
| Minimum | 0.25% | 0.18% |
| Maximum | 3.2% | 11.1% |
| Range | 3.0% | 10.9% |
| Mean | 1.3% | 2.4% |
| Median | 1.2% | 1.6% |
| Interquartile 25% (IQ1) | 0.84% | 1.1% |
| Interquartile 75% (IQ3) | 1.4% | 2.1% |
| Interquartile Range (IQR) | 0.57% | 1.0% |
| Standard Deviation (Sample) | 0.63% | 2.6% |
| Standard Deviation (Population) | 0.62% | 2.5% |
Similar Demographics by Disability Age Under 5
Demographics Similar to Sri Lankans by Disability Age Under 5
In terms of disability age under 5, the demographic groups most similar to Sri Lankans are Immigrants from Moldova (1.1%, a difference of 0.050%), Spanish American (1.1%, a difference of 0.060%), Immigrants from Cuba (1.1%, a difference of 0.090%), Mongolian (1.1%, a difference of 0.16%), and Albanian (1.1%, a difference of 0.26%).
| Demographics | Rating | Rank | Disability Age Under 5 |
| Ugandans | 97.5 /100 | #87 | Exceptional 1.1% |
| Immigrants | Dominican Republic | 97.5 /100 | #88 | Exceptional 1.1% |
| Ethiopians | 97.2 /100 | #89 | Exceptional 1.1% |
| Chinese | 97.2 /100 | #90 | Exceptional 1.1% |
| Albanians | 97.2 /100 | #91 | Exceptional 1.1% |
| Immigrants | Cuba | 97.0 /100 | #92 | Exceptional 1.1% |
| Spanish Americans | 96.9 /100 | #93 | Exceptional 1.1% |
| Sri Lankans | 96.8 /100 | #94 | Exceptional 1.1% |
| Immigrants | Moldova | 96.8 /100 | #95 | Exceptional 1.1% |
| Mongolians | 96.6 /100 | #96 | Exceptional 1.1% |
| Immigrants | Iraq | 96.5 /100 | #97 | Exceptional 1.1% |
| Immigrants | South Eastern Asia | 96.5 /100 | #98 | Exceptional 1.1% |
| Dominicans | 96.3 /100 | #99 | Exceptional 1.1% |
| Nicaraguans | 96.3 /100 | #100 | Exceptional 1.1% |
| Immigrants | Uganda | 96.1 /100 | #101 | Exceptional 1.1% |
Demographics Similar to Immigrants from Bosnia and Herzegovina by Disability Age Under 5
In terms of disability age under 5, the demographic groups most similar to Immigrants from Bosnia and Herzegovina are Mexican American Indian (1.3%, a difference of 0.0%), Immigrants from Sierra Leone (1.3%, a difference of 0.0%), Immigrants from Laos (1.3%, a difference of 0.010%), Peruvian (1.3%, a difference of 0.10%), and Immigrants from North Macedonia (1.3%, a difference of 0.18%).
| Demographics | Rating | Rank | Disability Age Under 5 |
| Immigrants | Western Africa | 42.5 /100 | #185 | Average 1.2% |
| Cubans | 42.5 /100 | #186 | Average 1.2% |
| Immigrants | Haiti | 40.2 /100 | #187 | Average 1.3% |
| Haitians | 39.9 /100 | #188 | Fair 1.3% |
| Peruvians | 37.6 /100 | #189 | Fair 1.3% |
| Immigrants | Laos | 36.6 /100 | #190 | Fair 1.3% |
| Mexican American Indians | 36.6 /100 | #191 | Fair 1.3% |
| Immigrants | Bosnia and Herzegovina | 36.5 /100 | #192 | Fair 1.3% |
| Immigrants | Sierra Leone | 36.5 /100 | #193 | Fair 1.3% |
| Immigrants | North Macedonia | 34.7 /100 | #194 | Fair 1.3% |
| U.S. Virgin Islanders | 34.4 /100 | #195 | Fair 1.3% |
| Immigrants | Belgium | 31.4 /100 | #196 | Fair 1.3% |
| Immigrants | Somalia | 31.3 /100 | #197 | Fair 1.3% |
| Immigrants | Norway | 31.1 /100 | #198 | Fair 1.3% |
| Jamaicans | 30.7 /100 | #199 | Fair 1.3% |