Alsatian vs Guatemalan Disability Age Under 5
COMPARE
Alsatian
Guatemalan
Disability Age Under 5
Disability Age Under 5 Comparison
Alsatians
Guatemalans
1.2%
DISABILITY AGE UNDER 5
79.3/ 100
METRIC RATING
143rd/ 347
METRIC RANK
1.2%
DISABILITY AGE UNDER 5
63.6/ 100
METRIC RATING
162nd/ 347
METRIC RANK
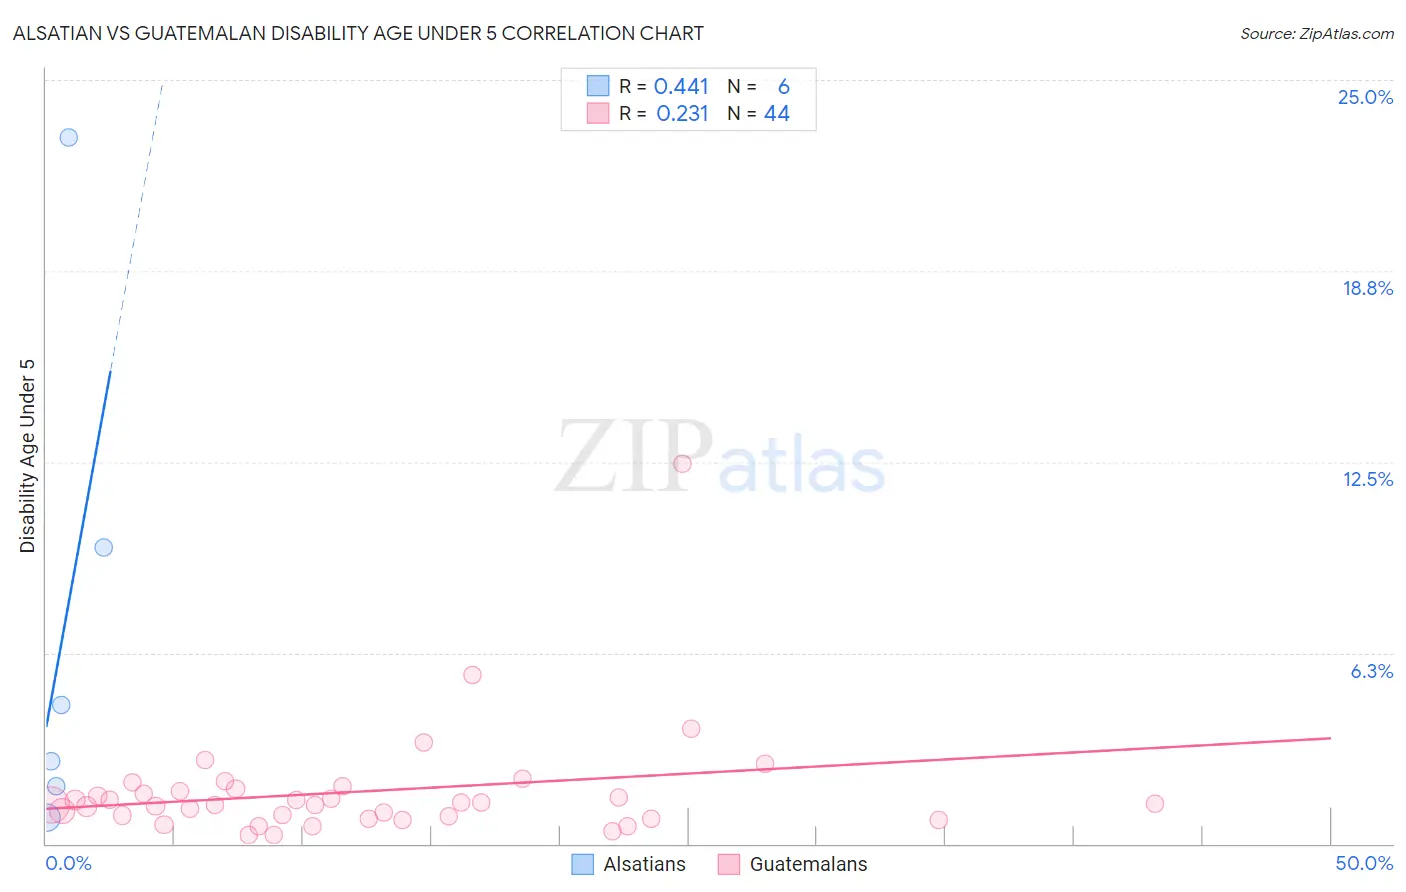
Alsatian vs Guatemalan Disability Age Under 5 Correlation Chart
The statistical analysis conducted on geographies consisting of 65,109,236 people shows a moderate positive correlation between the proportion of Alsatians and percentage of population with a disability under the age of 5 in the United States with a correlation coefficient (R) of 0.441 and weighted average of 1.2%. Similarly, the statistical analysis conducted on geographies consisting of 225,218,414 people shows a weak positive correlation between the proportion of Guatemalans and percentage of population with a disability under the age of 5 in the United States with a correlation coefficient (R) of 0.231 and weighted average of 1.2%, a difference of 1.8%.
Disability Age Under 5 Correlation Summary
| Measurement | Alsatian | Guatemalan |
| Minimum | 0.86% | 0.29% |
| Maximum | 23.1% | 12.4% |
| Range | 22.3% | 12.1% |
| Mean | 7.1% | 1.7% |
| Median | 3.6% | 1.3% |
| Interquartile 25% (IQ1) | 1.9% | 0.86% |
| Interquartile 75% (IQ3) | 9.7% | 1.8% |
| Interquartile Range (IQR) | 7.8% | 0.90% |
| Standard Deviation (Sample) | 8.4% | 1.9% |
| Standard Deviation (Population) | 7.7% | 1.9% |
Demographics Similar to Alsatians and Guatemalans by Disability Age Under 5
In terms of disability age under 5, the demographic groups most similar to Alsatians are Immigrants from Middle Africa (1.2%, a difference of 0.0%), Immigrants from Colombia (1.2%, a difference of 0.010%), Immigrants from Zimbabwe (1.2%, a difference of 0.19%), Samoan (1.2%, a difference of 0.22%), and Icelander (1.2%, a difference of 0.40%). Similarly, the demographic groups most similar to Guatemalans are Immigrants from Africa (1.2%, a difference of 0.15%), Colombian (1.2%, a difference of 0.22%), Immigrants from Latin America (1.2%, a difference of 0.22%), Arab (1.2%, a difference of 0.28%), and Immigrants from South America (1.2%, a difference of 0.35%).
| Demographics | Rating | Rank | Disability Age Under 5 |
| Immigrants | Colombia | 79.3 /100 | #142 | Good 1.2% |
| Alsatians | 79.3 /100 | #143 | Good 1.2% |
| Immigrants | Middle Africa | 79.3 /100 | #144 | Good 1.2% |
| Immigrants | Zimbabwe | 77.9 /100 | #145 | Good 1.2% |
| Samoans | 77.7 /100 | #146 | Good 1.2% |
| Icelanders | 76.3 /100 | #147 | Good 1.2% |
| Ghanaians | 76.3 /100 | #148 | Good 1.2% |
| Kenyans | 75.9 /100 | #149 | Good 1.2% |
| South Americans | 75.6 /100 | #150 | Good 1.2% |
| Yaqui | 74.8 /100 | #151 | Good 1.2% |
| Hondurans | 72.5 /100 | #152 | Good 1.2% |
| Immigrants | Thailand | 69.4 /100 | #153 | Good 1.2% |
| Uruguayans | 68.8 /100 | #154 | Good 1.2% |
| Immigrants | Ghana | 68.7 /100 | #155 | Good 1.2% |
| Hawaiians | 68.5 /100 | #156 | Good 1.2% |
| Immigrants | South America | 67.0 /100 | #157 | Good 1.2% |
| Arabs | 66.4 /100 | #158 | Good 1.2% |
| Colombians | 65.8 /100 | #159 | Good 1.2% |
| Immigrants | Latin America | 65.8 /100 | #160 | Good 1.2% |
| Immigrants | Africa | 65.1 /100 | #161 | Good 1.2% |
| Guatemalans | 63.6 /100 | #162 | Good 1.2% |