Aleut vs Afghan Male Disability
COMPARE
Aleut
Afghan
Male Disability
Male Disability Comparison
Aleuts
Afghans
13.5%
MALE DISABILITY
0.0/ 100
METRIC RATING
314th/ 347
METRIC RANK
10.2%
MALE DISABILITY
99.8/ 100
METRIC RATING
39th/ 347
METRIC RANK
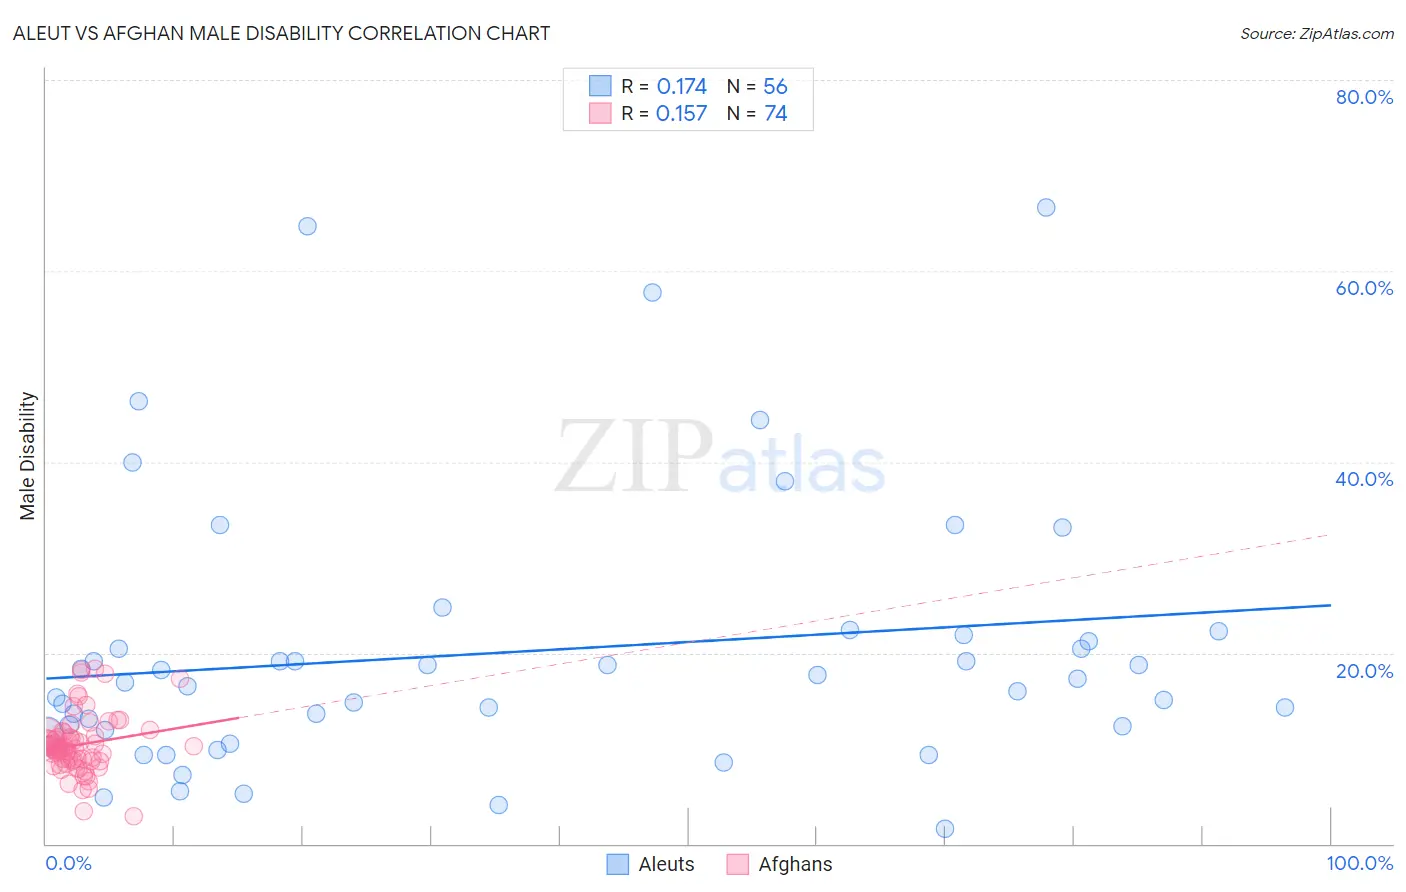
Aleut vs Afghan Male Disability Correlation Chart
The statistical analysis conducted on geographies consisting of 61,781,490 people shows a poor positive correlation between the proportion of Aleuts and percentage of males with a disability in the United States with a correlation coefficient (R) of 0.174 and weighted average of 13.5%. Similarly, the statistical analysis conducted on geographies consisting of 148,871,579 people shows a poor positive correlation between the proportion of Afghans and percentage of males with a disability in the United States with a correlation coefficient (R) of 0.157 and weighted average of 10.2%, a difference of 32.2%.
Male Disability Correlation Summary
| Measurement | Aleut | Afghan |
| Minimum | 1.6% | 2.9% |
| Maximum | 66.7% | 18.3% |
| Range | 65.1% | 15.4% |
| Mean | 20.1% | 10.4% |
| Median | 17.1% | 10.0% |
| Interquartile 25% (IQ1) | 12.2% | 8.7% |
| Interquartile 75% (IQ3) | 21.5% | 11.3% |
| Interquartile Range (IQR) | 9.4% | 2.6% |
| Standard Deviation (Sample) | 14.1% | 3.1% |
| Standard Deviation (Population) | 13.9% | 3.0% |
Similar Demographics by Male Disability
Demographics Similar to Aleuts by Male Disability
In terms of male disability, the demographic groups most similar to Aleuts are Puget Sound Salish (13.5%, a difference of 0.060%), Yakama (13.5%, a difference of 0.080%), Iroquois (13.6%, a difference of 0.16%), Alaska Native (13.6%, a difference of 0.21%), and Delaware (13.5%, a difference of 0.63%).
| Demographics | Rating | Rank | Male Disability |
| Arapaho | 0.0 /100 | #307 | Tragic 13.3% |
| French American Indians | 0.0 /100 | #308 | Tragic 13.4% |
| Blackfeet | 0.0 /100 | #309 | Tragic 13.4% |
| Immigrants | Azores | 0.0 /100 | #310 | Tragic 13.4% |
| Delaware | 0.0 /100 | #311 | Tragic 13.5% |
| Yakama | 0.0 /100 | #312 | Tragic 13.5% |
| Puget Sound Salish | 0.0 /100 | #313 | Tragic 13.5% |
| Aleuts | 0.0 /100 | #314 | Tragic 13.5% |
| Iroquois | 0.0 /100 | #315 | Tragic 13.6% |
| Alaska Natives | 0.0 /100 | #316 | Tragic 13.6% |
| Paiute | 0.0 /100 | #317 | Tragic 13.7% |
| Cree | 0.0 /100 | #318 | Tragic 13.7% |
| Americans | 0.0 /100 | #319 | Tragic 13.8% |
| Tlingit-Haida | 0.0 /100 | #320 | Tragic 13.8% |
| Shoshone | 0.0 /100 | #321 | Tragic 13.8% |
Demographics Similar to Afghans by Male Disability
In terms of male disability, the demographic groups most similar to Afghans are Immigrants from Kuwait (10.2%, a difference of 0.16%), Immigrants from Nepal (10.3%, a difference of 0.19%), Taiwanese (10.3%, a difference of 0.19%), Immigrants from Indonesia (10.2%, a difference of 0.33%), and Ethiopian (10.2%, a difference of 0.40%).
| Demographics | Rating | Rank | Male Disability |
| Argentineans | 99.9 /100 | #32 | Exceptional 10.1% |
| Immigrants | Ethiopia | 99.9 /100 | #33 | Exceptional 10.2% |
| Immigrants | Turkey | 99.9 /100 | #34 | Exceptional 10.2% |
| Immigrants | Argentina | 99.9 /100 | #35 | Exceptional 10.2% |
| Ethiopians | 99.8 /100 | #36 | Exceptional 10.2% |
| Immigrants | Indonesia | 99.8 /100 | #37 | Exceptional 10.2% |
| Immigrants | Kuwait | 99.8 /100 | #38 | Exceptional 10.2% |
| Afghans | 99.8 /100 | #39 | Exceptional 10.2% |
| Immigrants | Nepal | 99.8 /100 | #40 | Exceptional 10.3% |
| Taiwanese | 99.8 /100 | #41 | Exceptional 10.3% |
| Mongolians | 99.7 /100 | #42 | Exceptional 10.3% |
| Immigrants | Bangladesh | 99.7 /100 | #43 | Exceptional 10.3% |
| Immigrants | El Salvador | 99.7 /100 | #44 | Exceptional 10.3% |
| Turks | 99.7 /100 | #45 | Exceptional 10.3% |
| Cambodians | 99.7 /100 | #46 | Exceptional 10.3% |