Aleut vs Chinese Male Disability
COMPARE
Aleut
Chinese
Male Disability
Male Disability Comparison
Aleuts
Chinese
13.5%
MALE DISABILITY
0.0/ 100
METRIC RATING
314th/ 347
METRIC RANK
12.1%
MALE DISABILITY
0.4/ 100
METRIC RATING
255th/ 347
METRIC RANK
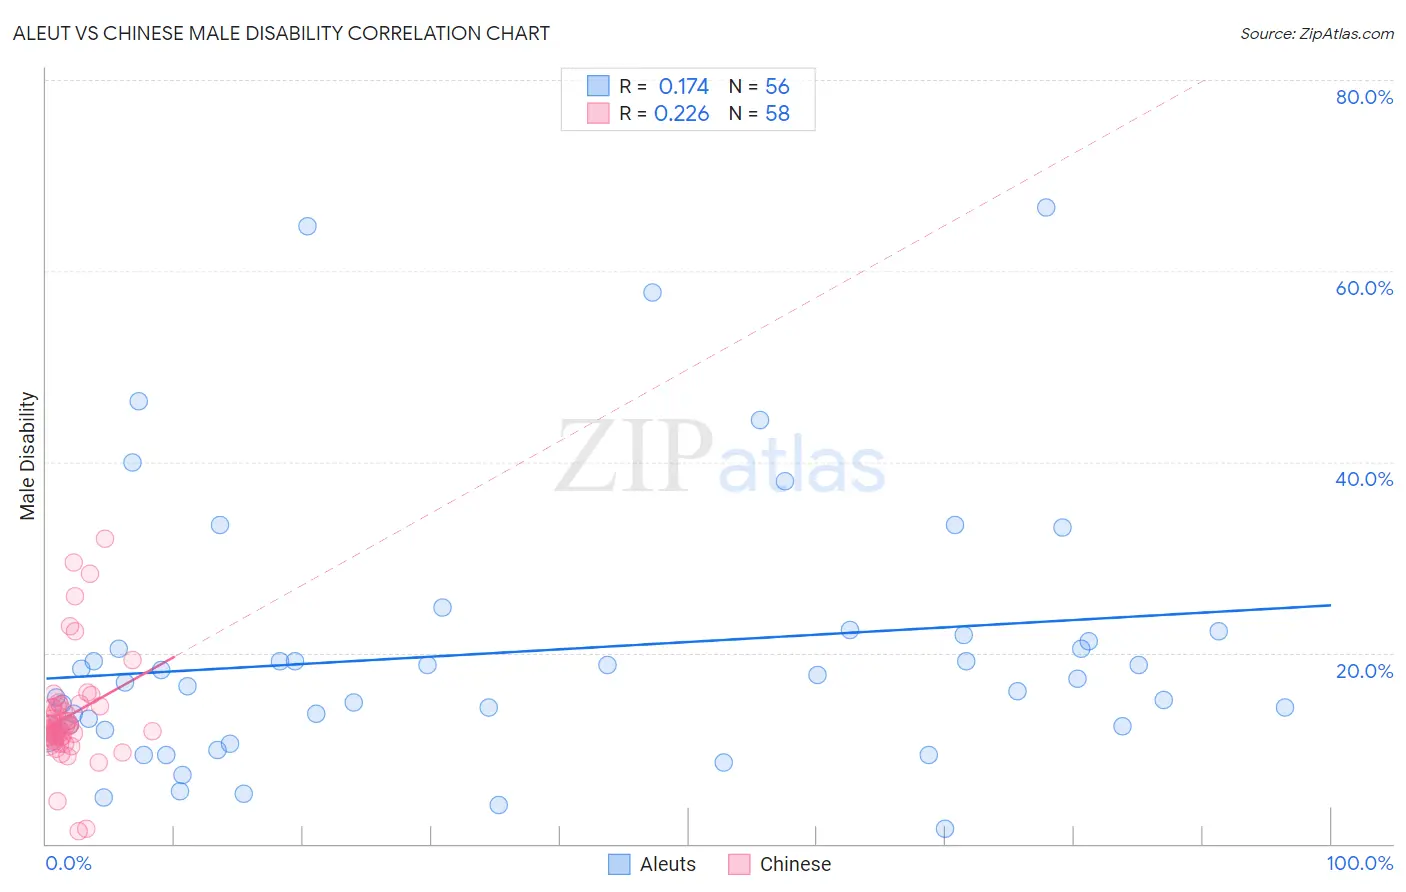
Aleut vs Chinese Male Disability Correlation Chart
The statistical analysis conducted on geographies consisting of 61,781,490 people shows a poor positive correlation between the proportion of Aleuts and percentage of males with a disability in the United States with a correlation coefficient (R) of 0.174 and weighted average of 13.5%. Similarly, the statistical analysis conducted on geographies consisting of 64,802,721 people shows a weak positive correlation between the proportion of Chinese and percentage of males with a disability in the United States with a correlation coefficient (R) of 0.226 and weighted average of 12.1%, a difference of 12.3%.
Male Disability Correlation Summary
| Measurement | Aleut | Chinese |
| Minimum | 1.6% | 1.3% |
| Maximum | 66.7% | 31.9% |
| Range | 65.1% | 30.7% |
| Mean | 20.1% | 13.4% |
| Median | 17.1% | 12.4% |
| Interquartile 25% (IQ1) | 12.2% | 11.1% |
| Interquartile 75% (IQ3) | 21.5% | 14.4% |
| Interquartile Range (IQR) | 9.4% | 3.3% |
| Standard Deviation (Sample) | 14.1% | 5.6% |
| Standard Deviation (Population) | 13.9% | 5.5% |
Similar Demographics by Male Disability
Demographics Similar to Aleuts by Male Disability
In terms of male disability, the demographic groups most similar to Aleuts are Puget Sound Salish (13.5%, a difference of 0.060%), Yakama (13.5%, a difference of 0.080%), Iroquois (13.6%, a difference of 0.16%), Alaska Native (13.6%, a difference of 0.21%), and Delaware (13.5%, a difference of 0.63%).
| Demographics | Rating | Rank | Male Disability |
| Arapaho | 0.0 /100 | #307 | Tragic 13.3% |
| French American Indians | 0.0 /100 | #308 | Tragic 13.4% |
| Blackfeet | 0.0 /100 | #309 | Tragic 13.4% |
| Immigrants | Azores | 0.0 /100 | #310 | Tragic 13.4% |
| Delaware | 0.0 /100 | #311 | Tragic 13.5% |
| Yakama | 0.0 /100 | #312 | Tragic 13.5% |
| Puget Sound Salish | 0.0 /100 | #313 | Tragic 13.5% |
| Aleuts | 0.0 /100 | #314 | Tragic 13.5% |
| Iroquois | 0.0 /100 | #315 | Tragic 13.6% |
| Alaska Natives | 0.0 /100 | #316 | Tragic 13.6% |
| Paiute | 0.0 /100 | #317 | Tragic 13.7% |
| Cree | 0.0 /100 | #318 | Tragic 13.7% |
| Americans | 0.0 /100 | #319 | Tragic 13.8% |
| Tlingit-Haida | 0.0 /100 | #320 | Tragic 13.8% |
| Shoshone | 0.0 /100 | #321 | Tragic 13.8% |
Demographics Similar to Chinese by Male Disability
In terms of male disability, the demographic groups most similar to Chinese are British (12.1%, a difference of 0.010%), Slovene (12.0%, a difference of 0.20%), Guamanian/Chamorro (12.0%, a difference of 0.20%), Swiss (12.1%, a difference of 0.25%), and European (12.1%, a difference of 0.25%).
| Demographics | Rating | Rank | Male Disability |
| Poles | 0.7 /100 | #248 | Tragic 12.0% |
| Immigrants | Yemen | 0.5 /100 | #249 | Tragic 12.0% |
| Bangladeshis | 0.5 /100 | #250 | Tragic 12.0% |
| German Russians | 0.5 /100 | #251 | Tragic 12.0% |
| Slovenes | 0.5 /100 | #252 | Tragic 12.0% |
| Guamanians/Chamorros | 0.5 /100 | #253 | Tragic 12.0% |
| British | 0.4 /100 | #254 | Tragic 12.1% |
| Chinese | 0.4 /100 | #255 | Tragic 12.1% |
| Swiss | 0.3 /100 | #256 | Tragic 12.1% |
| Europeans | 0.3 /100 | #257 | Tragic 12.1% |
| Basques | 0.3 /100 | #258 | Tragic 12.1% |
| Belgians | 0.3 /100 | #259 | Tragic 12.1% |
| Swedes | 0.3 /100 | #260 | Tragic 12.1% |
| Slavs | 0.2 /100 | #261 | Tragic 12.2% |
| Norwegians | 0.2 /100 | #262 | Tragic 12.2% |