Aleut vs Afghan Single Mother Households
COMPARE
Aleut
Afghan
Single Mother Households
Single Mother Households Comparison
Aleuts
Afghans
6.8%
SINGLE MOTHER HOUSEHOLDS
4.8/ 100
METRIC RATING
217th/ 347
METRIC RANK
6.3%
SINGLE MOTHER HOUSEHOLDS
52.5/ 100
METRIC RATING
171st/ 347
METRIC RANK
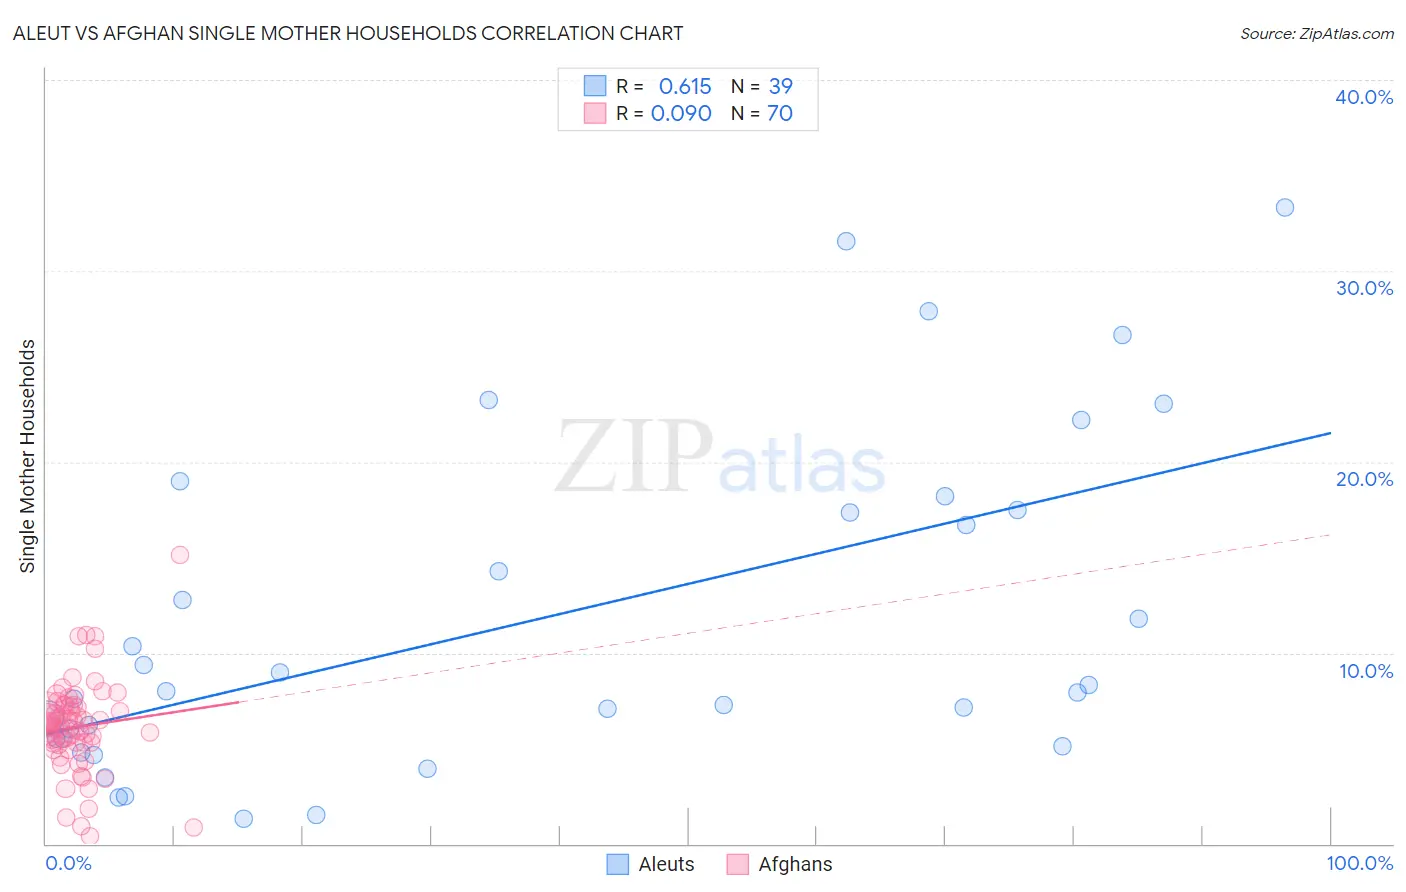
Aleut vs Afghan Single Mother Households Correlation Chart
The statistical analysis conducted on geographies consisting of 61,699,549 people shows a significant positive correlation between the proportion of Aleuts and percentage of single mother households in the United States with a correlation coefficient (R) of 0.615 and weighted average of 6.8%. Similarly, the statistical analysis conducted on geographies consisting of 148,722,502 people shows a slight positive correlation between the proportion of Afghans and percentage of single mother households in the United States with a correlation coefficient (R) of 0.090 and weighted average of 6.3%, a difference of 8.5%.
Single Mother Households Correlation Summary
| Measurement | Aleut | Afghan |
| Minimum | 1.3% | 0.41% |
| Maximum | 33.3% | 15.1% |
| Range | 32.0% | 14.7% |
| Mean | 11.7% | 6.1% |
| Median | 8.0% | 6.1% |
| Interquartile 25% (IQ1) | 5.5% | 5.3% |
| Interquartile 75% (IQ3) | 17.5% | 7.2% |
| Interquartile Range (IQR) | 12.0% | 2.0% |
| Standard Deviation (Sample) | 8.7% | 2.4% |
| Standard Deviation (Population) | 8.6% | 2.4% |
Similar Demographics by Single Mother Households
Demographics Similar to Aleuts by Single Mother Households
In terms of single mother households, the demographic groups most similar to Aleuts are Cherokee (6.8%, a difference of 0.14%), Immigrants from Eastern Africa (6.8%, a difference of 0.21%), Immigrants (6.8%, a difference of 0.30%), Shoshone (6.8%, a difference of 0.44%), and Immigrants from Thailand (6.9%, a difference of 0.49%).
| Demographics | Rating | Rank | Single Mother Households |
| Immigrants | Nonimmigrants | 10.4 /100 | #210 | Poor 6.7% |
| Immigrants | Venezuela | 8.5 /100 | #211 | Tragic 6.7% |
| Immigrants | Eritrea | 8.4 /100 | #212 | Tragic 6.7% |
| Immigrants | Costa Rica | 8.2 /100 | #213 | Tragic 6.7% |
| Immigrants | Uruguay | 7.9 /100 | #214 | Tragic 6.7% |
| Shoshone | 5.7 /100 | #215 | Tragic 6.8% |
| Cherokee | 5.1 /100 | #216 | Tragic 6.8% |
| Aleuts | 4.8 /100 | #217 | Tragic 6.8% |
| Immigrants | Eastern Africa | 4.4 /100 | #218 | Tragic 6.8% |
| Immigrants | Immigrants | 4.3 /100 | #219 | Tragic 6.8% |
| Immigrants | Thailand | 4.0 /100 | #220 | Tragic 6.9% |
| French American Indians | 3.7 /100 | #221 | Tragic 6.9% |
| Immigrants | Bangladesh | 3.7 /100 | #222 | Tragic 6.9% |
| Immigrants | Micronesia | 3.6 /100 | #223 | Tragic 6.9% |
| Immigrants | Sudan | 3.5 /100 | #224 | Tragic 6.9% |
Demographics Similar to Afghans by Single Mother Households
In terms of single mother households, the demographic groups most similar to Afghans are Immigrants from South Eastern Asia (6.3%, a difference of 0.040%), Immigrants from Vietnam (6.3%, a difference of 0.11%), Immigrants from Oceania (6.3%, a difference of 0.23%), Immigrants from Morocco (6.3%, a difference of 0.28%), and Puget Sound Salish (6.3%, a difference of 0.63%).
| Demographics | Rating | Rank | Single Mother Households |
| Immigrants | Northern Africa | 68.0 /100 | #164 | Good 6.2% |
| Immigrants | Syria | 67.4 /100 | #165 | Good 6.2% |
| Sri Lankans | 63.9 /100 | #166 | Good 6.2% |
| Brazilians | 59.1 /100 | #167 | Average 6.2% |
| Immigrants | Chile | 58.3 /100 | #168 | Average 6.3% |
| Puget Sound Salish | 58.1 /100 | #169 | Average 6.3% |
| Immigrants | Oceania | 54.6 /100 | #170 | Average 6.3% |
| Afghans | 52.5 /100 | #171 | Average 6.3% |
| Immigrants | South Eastern Asia | 52.2 /100 | #172 | Average 6.3% |
| Immigrants | Vietnam | 51.5 /100 | #173 | Average 6.3% |
| Immigrants | Morocco | 50.0 /100 | #174 | Average 6.3% |
| Marshallese | 45.8 /100 | #175 | Average 6.3% |
| Immigrants | Bosnia and Herzegovina | 44.3 /100 | #176 | Average 6.3% |
| Osage | 43.0 /100 | #177 | Average 6.4% |
| Portuguese | 40.0 /100 | #178 | Fair 6.4% |