Aleut vs British West Indian Male Disability
COMPARE
Aleut
British West Indian
Male Disability
Male Disability Comparison
Aleuts
British West Indians
13.5%
MALE DISABILITY
0.0/ 100
METRIC RATING
314th/ 347
METRIC RANK
11.1%
MALE DISABILITY
62.8/ 100
METRIC RATING
164th/ 347
METRIC RANK
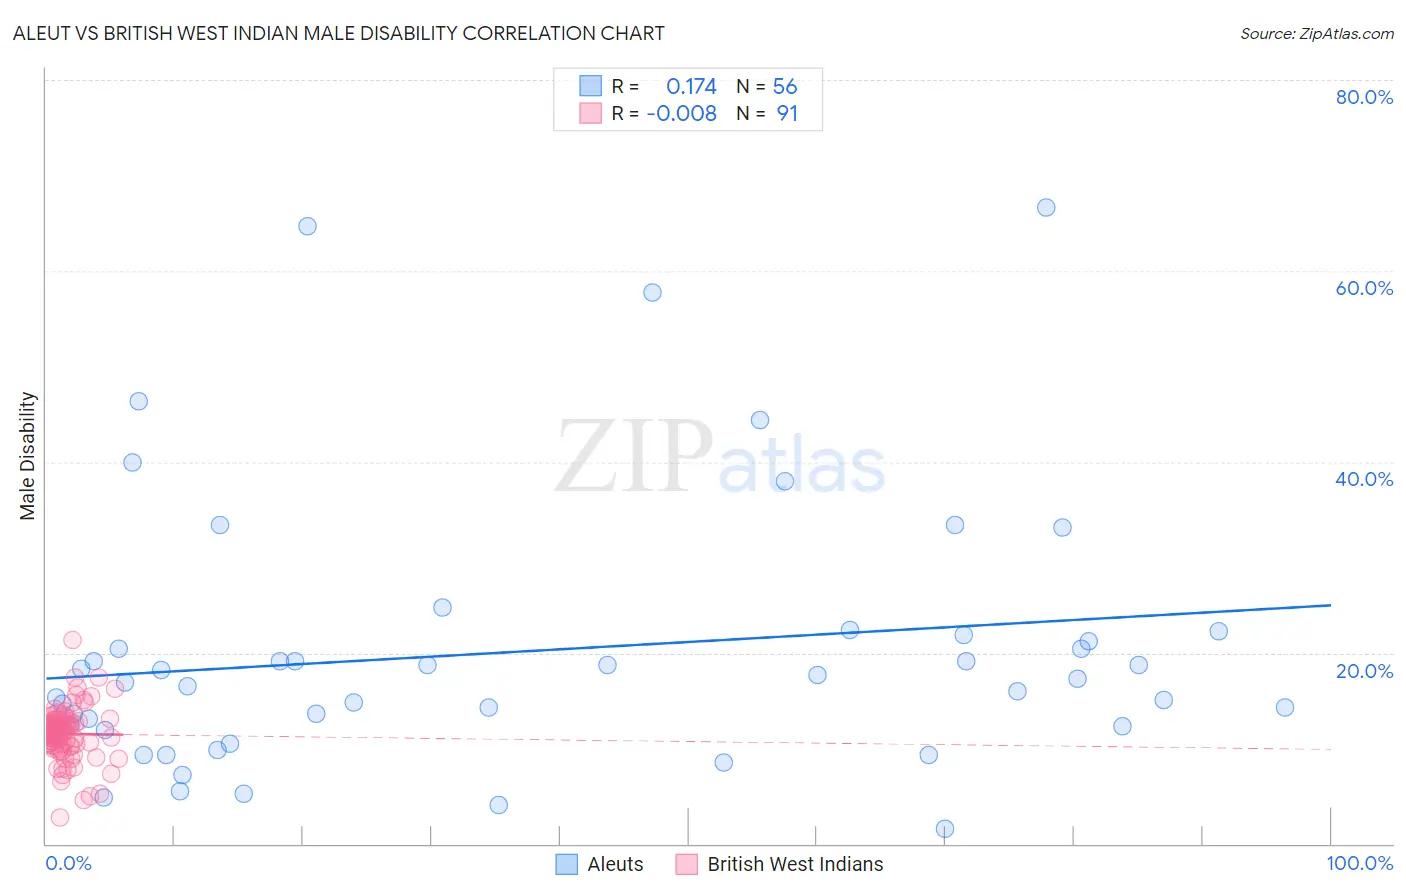
Aleut vs British West Indian Male Disability Correlation Chart
The statistical analysis conducted on geographies consisting of 61,781,490 people shows a poor positive correlation between the proportion of Aleuts and percentage of males with a disability in the United States with a correlation coefficient (R) of 0.174 and weighted average of 13.5%. Similarly, the statistical analysis conducted on geographies consisting of 152,682,334 people shows no correlation between the proportion of British West Indians and percentage of males with a disability in the United States with a correlation coefficient (R) of -0.008 and weighted average of 11.1%, a difference of 21.7%.
Male Disability Correlation Summary
| Measurement | Aleut | British West Indian |
| Minimum | 1.6% | 2.8% |
| Maximum | 66.7% | 21.3% |
| Range | 65.1% | 18.5% |
| Mean | 20.1% | 11.5% |
| Median | 17.1% | 11.7% |
| Interquartile 25% (IQ1) | 12.2% | 10.2% |
| Interquartile 75% (IQ3) | 21.5% | 12.8% |
| Interquartile Range (IQR) | 9.4% | 2.6% |
| Standard Deviation (Sample) | 14.1% | 2.8% |
| Standard Deviation (Population) | 13.9% | 2.8% |
Similar Demographics by Male Disability
Demographics Similar to Aleuts by Male Disability
In terms of male disability, the demographic groups most similar to Aleuts are Puget Sound Salish (13.5%, a difference of 0.060%), Yakama (13.5%, a difference of 0.080%), Iroquois (13.6%, a difference of 0.16%), Alaska Native (13.6%, a difference of 0.21%), and Delaware (13.5%, a difference of 0.63%).
| Demographics | Rating | Rank | Male Disability |
| Arapaho | 0.0 /100 | #307 | Tragic 13.3% |
| French American Indians | 0.0 /100 | #308 | Tragic 13.4% |
| Blackfeet | 0.0 /100 | #309 | Tragic 13.4% |
| Immigrants | Azores | 0.0 /100 | #310 | Tragic 13.4% |
| Delaware | 0.0 /100 | #311 | Tragic 13.5% |
| Yakama | 0.0 /100 | #312 | Tragic 13.5% |
| Puget Sound Salish | 0.0 /100 | #313 | Tragic 13.5% |
| Aleuts | 0.0 /100 | #314 | Tragic 13.5% |
| Iroquois | 0.0 /100 | #315 | Tragic 13.6% |
| Alaska Natives | 0.0 /100 | #316 | Tragic 13.6% |
| Paiute | 0.0 /100 | #317 | Tragic 13.7% |
| Cree | 0.0 /100 | #318 | Tragic 13.7% |
| Americans | 0.0 /100 | #319 | Tragic 13.8% |
| Tlingit-Haida | 0.0 /100 | #320 | Tragic 13.8% |
| Shoshone | 0.0 /100 | #321 | Tragic 13.8% |
Demographics Similar to British West Indians by Male Disability
In terms of male disability, the demographic groups most similar to British West Indians are Luxembourger (11.1%, a difference of 0.050%), Immigrants from Kenya (11.1%, a difference of 0.060%), Immigrants from Hungary (11.1%, a difference of 0.090%), Immigrants from Haiti (11.1%, a difference of 0.15%), and Immigrants from West Indies (11.1%, a difference of 0.18%).
| Demographics | Rating | Rank | Male Disability |
| Immigrants | Western Africa | 69.2 /100 | #157 | Good 11.1% |
| Latvians | 68.1 /100 | #158 | Good 11.1% |
| Guatemalans | 67.2 /100 | #159 | Good 11.1% |
| Albanians | 66.5 /100 | #160 | Good 11.1% |
| Immigrants | West Indies | 65.7 /100 | #161 | Good 11.1% |
| Immigrants | Haiti | 65.3 /100 | #162 | Good 11.1% |
| Immigrants | Kenya | 63.8 /100 | #163 | Good 11.1% |
| British West Indians | 62.8 /100 | #164 | Good 11.1% |
| Luxembourgers | 61.9 /100 | #165 | Good 11.1% |
| Immigrants | Hungary | 61.2 /100 | #166 | Good 11.1% |
| Immigrants | Southern Europe | 54.4 /100 | #167 | Average 11.2% |
| Immigrants | Latin America | 54.0 /100 | #168 | Average 11.2% |
| Barbadians | 53.4 /100 | #169 | Average 11.2% |
| New Zealanders | 52.9 /100 | #170 | Average 11.2% |
| Haitians | 52.5 /100 | #171 | Average 11.2% |