Sri Lankan vs Afghan Male Disability
COMPARE
Sri Lankan
Afghan
Male Disability
Male Disability Comparison
Sri Lankans
Afghans
10.6%
MALE DISABILITY
97.9/ 100
METRIC RATING
85th/ 347
METRIC RANK
10.2%
MALE DISABILITY
99.8/ 100
METRIC RATING
39th/ 347
METRIC RANK
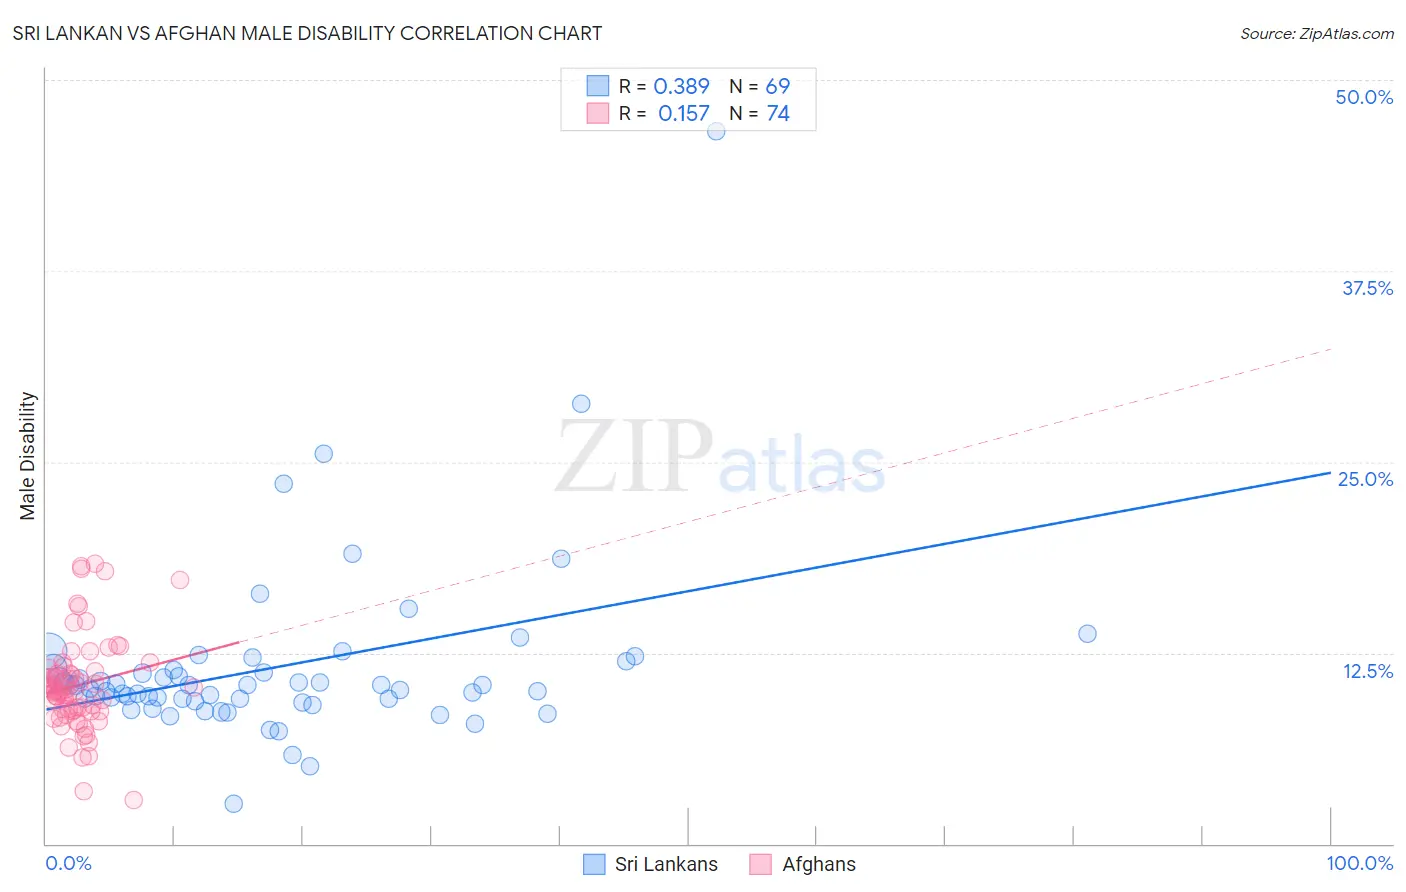
Sri Lankan vs Afghan Male Disability Correlation Chart
The statistical analysis conducted on geographies consisting of 440,468,198 people shows a mild positive correlation between the proportion of Sri Lankans and percentage of males with a disability in the United States with a correlation coefficient (R) of 0.389 and weighted average of 10.6%. Similarly, the statistical analysis conducted on geographies consisting of 148,871,579 people shows a poor positive correlation between the proportion of Afghans and percentage of males with a disability in the United States with a correlation coefficient (R) of 0.157 and weighted average of 10.2%, a difference of 3.6%.
Male Disability Correlation Summary
| Measurement | Sri Lankan | Afghan |
| Minimum | 2.6% | 2.9% |
| Maximum | 46.7% | 18.3% |
| Range | 44.0% | 15.4% |
| Mean | 11.6% | 10.4% |
| Median | 10.4% | 10.0% |
| Interquartile 25% (IQ1) | 9.4% | 8.7% |
| Interquartile 75% (IQ3) | 11.4% | 11.3% |
| Interquartile Range (IQR) | 2.0% | 2.6% |
| Standard Deviation (Sample) | 5.9% | 3.1% |
| Standard Deviation (Population) | 5.9% | 3.0% |
Similar Demographics by Male Disability
Demographics Similar to Sri Lankans by Male Disability
In terms of male disability, the demographic groups most similar to Sri Lankans are Immigrants from Ireland (10.6%, a difference of 0.010%), Immigrants from Vietnam (10.6%, a difference of 0.030%), Immigrants from Western Asia (10.6%, a difference of 0.10%), Immigrants from Nicaragua (10.6%, a difference of 0.10%), and Immigrants from Morocco (10.6%, a difference of 0.15%).
| Demographics | Rating | Rank | Male Disability |
| Immigrants | Russia | 98.6 /100 | #78 | Exceptional 10.6% |
| Zimbabweans | 98.4 /100 | #79 | Exceptional 10.6% |
| Immigrants | Jordan | 98.4 /100 | #80 | Exceptional 10.6% |
| Immigrants | Chile | 98.3 /100 | #81 | Exceptional 10.6% |
| Immigrants | Guyana | 98.2 /100 | #82 | Exceptional 10.6% |
| Immigrants | Poland | 98.1 /100 | #83 | Exceptional 10.6% |
| Bulgarians | 98.1 /100 | #84 | Exceptional 10.6% |
| Sri Lankans | 97.9 /100 | #85 | Exceptional 10.6% |
| Immigrants | Ireland | 97.9 /100 | #86 | Exceptional 10.6% |
| Immigrants | Vietnam | 97.9 /100 | #87 | Exceptional 10.6% |
| Immigrants | Western Asia | 97.8 /100 | #88 | Exceptional 10.6% |
| Immigrants | Nicaragua | 97.8 /100 | #89 | Exceptional 10.6% |
| Immigrants | Morocco | 97.7 /100 | #90 | Exceptional 10.6% |
| Immigrants | France | 97.6 /100 | #91 | Exceptional 10.6% |
| Palestinians | 97.4 /100 | #92 | Exceptional 10.7% |
Demographics Similar to Afghans by Male Disability
In terms of male disability, the demographic groups most similar to Afghans are Immigrants from Kuwait (10.2%, a difference of 0.16%), Immigrants from Nepal (10.3%, a difference of 0.19%), Taiwanese (10.3%, a difference of 0.19%), Immigrants from Indonesia (10.2%, a difference of 0.33%), and Ethiopian (10.2%, a difference of 0.40%).
| Demographics | Rating | Rank | Male Disability |
| Argentineans | 99.9 /100 | #32 | Exceptional 10.1% |
| Immigrants | Ethiopia | 99.9 /100 | #33 | Exceptional 10.2% |
| Immigrants | Turkey | 99.9 /100 | #34 | Exceptional 10.2% |
| Immigrants | Argentina | 99.9 /100 | #35 | Exceptional 10.2% |
| Ethiopians | 99.8 /100 | #36 | Exceptional 10.2% |
| Immigrants | Indonesia | 99.8 /100 | #37 | Exceptional 10.2% |
| Immigrants | Kuwait | 99.8 /100 | #38 | Exceptional 10.2% |
| Afghans | 99.8 /100 | #39 | Exceptional 10.2% |
| Immigrants | Nepal | 99.8 /100 | #40 | Exceptional 10.3% |
| Taiwanese | 99.8 /100 | #41 | Exceptional 10.3% |
| Mongolians | 99.7 /100 | #42 | Exceptional 10.3% |
| Immigrants | Bangladesh | 99.7 /100 | #43 | Exceptional 10.3% |
| Immigrants | El Salvador | 99.7 /100 | #44 | Exceptional 10.3% |
| Turks | 99.7 /100 | #45 | Exceptional 10.3% |
| Cambodians | 99.7 /100 | #46 | Exceptional 10.3% |