Aleut vs Afghan Cognitive Disability
COMPARE
Aleut
Afghan
Cognitive Disability
Cognitive Disability Comparison
Aleuts
Afghans
17.0%
COGNITIVE DISABILITY
89.9/ 100
METRIC RATING
141st/ 347
METRIC RANK
17.3%
COGNITIVE DISABILITY
38.2/ 100
METRIC RATING
185th/ 347
METRIC RANK
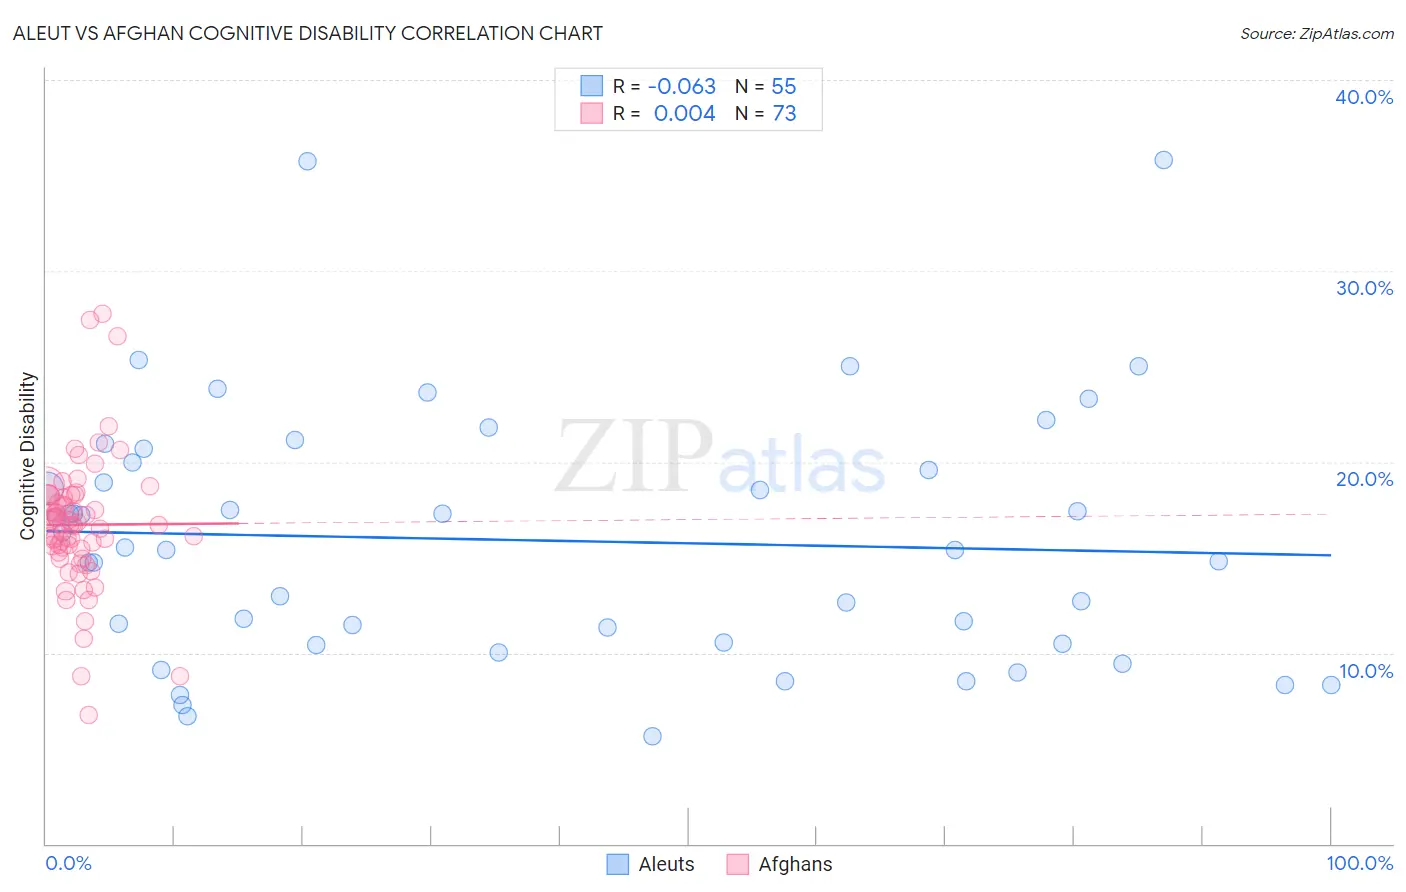
Aleut vs Afghan Cognitive Disability Correlation Chart
The statistical analysis conducted on geographies consisting of 61,782,027 people shows a slight negative correlation between the proportion of Aleuts and percentage of population with cognitive disability in the United States with a correlation coefficient (R) of -0.063 and weighted average of 17.0%. Similarly, the statistical analysis conducted on geographies consisting of 148,870,382 people shows no correlation between the proportion of Afghans and percentage of population with cognitive disability in the United States with a correlation coefficient (R) of 0.004 and weighted average of 17.3%, a difference of 1.9%.
Cognitive Disability Correlation Summary
| Measurement | Aleut | Afghan |
| Minimum | 5.7% | 6.7% |
| Maximum | 35.8% | 27.8% |
| Range | 30.2% | 21.0% |
| Mean | 15.9% | 16.7% |
| Median | 15.4% | 16.7% |
| Interquartile 25% (IQ1) | 10.5% | 15.3% |
| Interquartile 75% (IQ3) | 20.0% | 18.2% |
| Interquartile Range (IQR) | 9.5% | 2.9% |
| Standard Deviation (Sample) | 6.6% | 3.5% |
| Standard Deviation (Population) | 6.6% | 3.5% |
Similar Demographics by Cognitive Disability
Demographics Similar to Aleuts by Cognitive Disability
In terms of cognitive disability, the demographic groups most similar to Aleuts are French (17.0%, a difference of 0.0%), Chilean (17.0%, a difference of 0.0%), Carpatho Rusyn (17.0%, a difference of 0.020%), British (17.0%, a difference of 0.050%), and Immigrants from Brazil (17.0%, a difference of 0.050%).
| Demographics | Rating | Rank | Cognitive Disability |
| Immigrants | Chile | 91.7 /100 | #134 | Exceptional 17.0% |
| Lebanese | 91.3 /100 | #135 | Exceptional 17.0% |
| Israelis | 91.0 /100 | #136 | Exceptional 17.0% |
| Immigrants | Norway | 90.9 /100 | #137 | Exceptional 17.0% |
| Welsh | 90.8 /100 | #138 | Exceptional 17.0% |
| French | 90.0 /100 | #139 | Excellent 17.0% |
| Chileans | 89.9 /100 | #140 | Excellent 17.0% |
| Aleuts | 89.9 /100 | #141 | Excellent 17.0% |
| Carpatho Rusyns | 89.6 /100 | #142 | Excellent 17.0% |
| British | 89.3 /100 | #143 | Excellent 17.0% |
| Immigrants | Brazil | 89.3 /100 | #144 | Excellent 17.0% |
| Immigrants | South Eastern Asia | 88.7 /100 | #145 | Excellent 17.0% |
| Costa Ricans | 88.0 /100 | #146 | Excellent 17.0% |
| Scotch-Irish | 85.9 /100 | #147 | Excellent 17.1% |
| French Canadians | 85.7 /100 | #148 | Excellent 17.1% |
Demographics Similar to Afghans by Cognitive Disability
In terms of cognitive disability, the demographic groups most similar to Afghans are Crow (17.3%, a difference of 0.030%), Spaniard (17.3%, a difference of 0.060%), Cambodian (17.3%, a difference of 0.070%), Immigrants from Guyana (17.3%, a difference of 0.14%), and Arab (17.3%, a difference of 0.14%).
| Demographics | Rating | Rank | Cognitive Disability |
| Spanish | 48.9 /100 | #178 | Average 17.3% |
| Sioux | 48.6 /100 | #179 | Average 17.3% |
| Pakistanis | 43.9 /100 | #180 | Average 17.3% |
| Immigrants | Guyana | 42.9 /100 | #181 | Average 17.3% |
| Arabs | 42.8 /100 | #182 | Average 17.3% |
| Spaniards | 40.3 /100 | #183 | Average 17.3% |
| Crow | 39.1 /100 | #184 | Fair 17.3% |
| Afghans | 38.2 /100 | #185 | Fair 17.3% |
| Cambodians | 35.9 /100 | #186 | Fair 17.3% |
| Immigrants | Fiji | 33.7 /100 | #187 | Fair 17.4% |
| Immigrants | France | 29.8 /100 | #188 | Fair 17.4% |
| Immigrants | Western Asia | 29.5 /100 | #189 | Fair 17.4% |
| Immigrants | Spain | 27.7 /100 | #190 | Fair 17.4% |
| Immigrants | Nonimmigrants | 27.4 /100 | #191 | Fair 17.4% |
| Immigrants | Haiti | 27.1 /100 | #192 | Fair 17.4% |