Aleut vs Jordanian Male Disability
COMPARE
Aleut
Jordanian
Male Disability
Male Disability Comparison
Aleuts
Jordanians
13.5%
MALE DISABILITY
0.0/ 100
METRIC RATING
314th/ 347
METRIC RANK
10.5%
MALE DISABILITY
99.3/ 100
METRIC RATING
64th/ 347
METRIC RANK
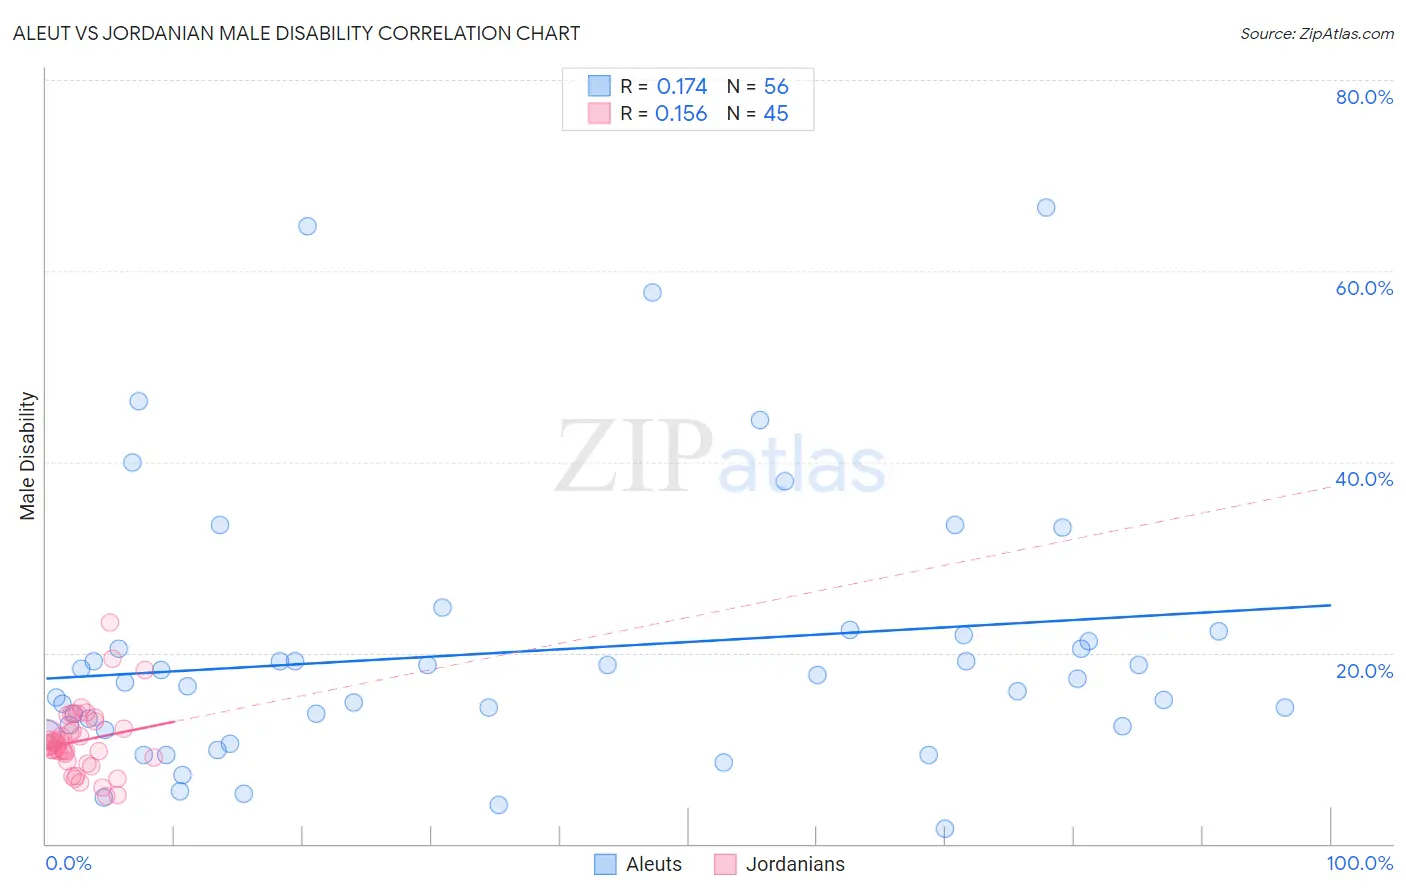
Aleut vs Jordanian Male Disability Correlation Chart
The statistical analysis conducted on geographies consisting of 61,781,490 people shows a poor positive correlation between the proportion of Aleuts and percentage of males with a disability in the United States with a correlation coefficient (R) of 0.174 and weighted average of 13.5%. Similarly, the statistical analysis conducted on geographies consisting of 166,415,761 people shows a poor positive correlation between the proportion of Jordanians and percentage of males with a disability in the United States with a correlation coefficient (R) of 0.156 and weighted average of 10.5%, a difference of 29.6%.
Male Disability Correlation Summary
| Measurement | Aleut | Jordanian |
| Minimum | 1.6% | 5.0% |
| Maximum | 66.7% | 23.2% |
| Range | 65.1% | 18.1% |
| Mean | 20.1% | 10.8% |
| Median | 17.1% | 10.4% |
| Interquartile 25% (IQ1) | 12.2% | 8.8% |
| Interquartile 75% (IQ3) | 21.5% | 12.4% |
| Interquartile Range (IQR) | 9.4% | 3.6% |
| Standard Deviation (Sample) | 14.1% | 3.5% |
| Standard Deviation (Population) | 13.9% | 3.5% |
Similar Demographics by Male Disability
Demographics Similar to Aleuts by Male Disability
In terms of male disability, the demographic groups most similar to Aleuts are Puget Sound Salish (13.5%, a difference of 0.060%), Yakama (13.5%, a difference of 0.080%), Iroquois (13.6%, a difference of 0.16%), Alaska Native (13.6%, a difference of 0.21%), and Delaware (13.5%, a difference of 0.63%).
| Demographics | Rating | Rank | Male Disability |
| Arapaho | 0.0 /100 | #307 | Tragic 13.3% |
| French American Indians | 0.0 /100 | #308 | Tragic 13.4% |
| Blackfeet | 0.0 /100 | #309 | Tragic 13.4% |
| Immigrants | Azores | 0.0 /100 | #310 | Tragic 13.4% |
| Delaware | 0.0 /100 | #311 | Tragic 13.5% |
| Yakama | 0.0 /100 | #312 | Tragic 13.5% |
| Puget Sound Salish | 0.0 /100 | #313 | Tragic 13.5% |
| Aleuts | 0.0 /100 | #314 | Tragic 13.5% |
| Iroquois | 0.0 /100 | #315 | Tragic 13.6% |
| Alaska Natives | 0.0 /100 | #316 | Tragic 13.6% |
| Paiute | 0.0 /100 | #317 | Tragic 13.7% |
| Cree | 0.0 /100 | #318 | Tragic 13.7% |
| Americans | 0.0 /100 | #319 | Tragic 13.8% |
| Tlingit-Haida | 0.0 /100 | #320 | Tragic 13.8% |
| Shoshone | 0.0 /100 | #321 | Tragic 13.8% |
Demographics Similar to Jordanians by Male Disability
In terms of male disability, the demographic groups most similar to Jordanians are Immigrants from Grenada (10.5%, a difference of 0.020%), Guyanese (10.5%, a difference of 0.030%), Immigrants from Afghanistan (10.5%, a difference of 0.030%), Immigrants from Belarus (10.4%, a difference of 0.12%), and Colombian (10.5%, a difference of 0.13%).
| Demographics | Rating | Rank | Male Disability |
| Immigrants | South America | 99.6 /100 | #57 | Exceptional 10.4% |
| Immigrants | Japan | 99.5 /100 | #58 | Exceptional 10.4% |
| Immigrants | Australia | 99.5 /100 | #59 | Exceptional 10.4% |
| Immigrants | Colombia | 99.5 /100 | #60 | Exceptional 10.4% |
| Immigrants | Northern Africa | 99.4 /100 | #61 | Exceptional 10.4% |
| Immigrants | Ecuador | 99.3 /100 | #62 | Exceptional 10.4% |
| Immigrants | Belarus | 99.3 /100 | #63 | Exceptional 10.4% |
| Jordanians | 99.3 /100 | #64 | Exceptional 10.5% |
| Immigrants | Grenada | 99.2 /100 | #65 | Exceptional 10.5% |
| Guyanese | 99.2 /100 | #66 | Exceptional 10.5% |
| Immigrants | Afghanistan | 99.2 /100 | #67 | Exceptional 10.5% |
| Colombians | 99.2 /100 | #68 | Exceptional 10.5% |
| Ecuadorians | 99.2 /100 | #69 | Exceptional 10.5% |
| Immigrants | Bulgaria | 99.1 /100 | #70 | Exceptional 10.5% |
| Immigrants | Cameroon | 99.0 /100 | #71 | Exceptional 10.5% |