Albanian vs Immigrants from Laos Vision Disability
COMPARE
Albanian
Immigrants from Laos
Vision Disability
Vision Disability Comparison
Albanians
Immigrants from Laos
2.1%
VISION DISABILITY
94.9/ 100
METRIC RATING
101st/ 347
METRIC RANK
2.4%
VISION DISABILITY
0.4/ 100
METRIC RATING
251st/ 347
METRIC RANK
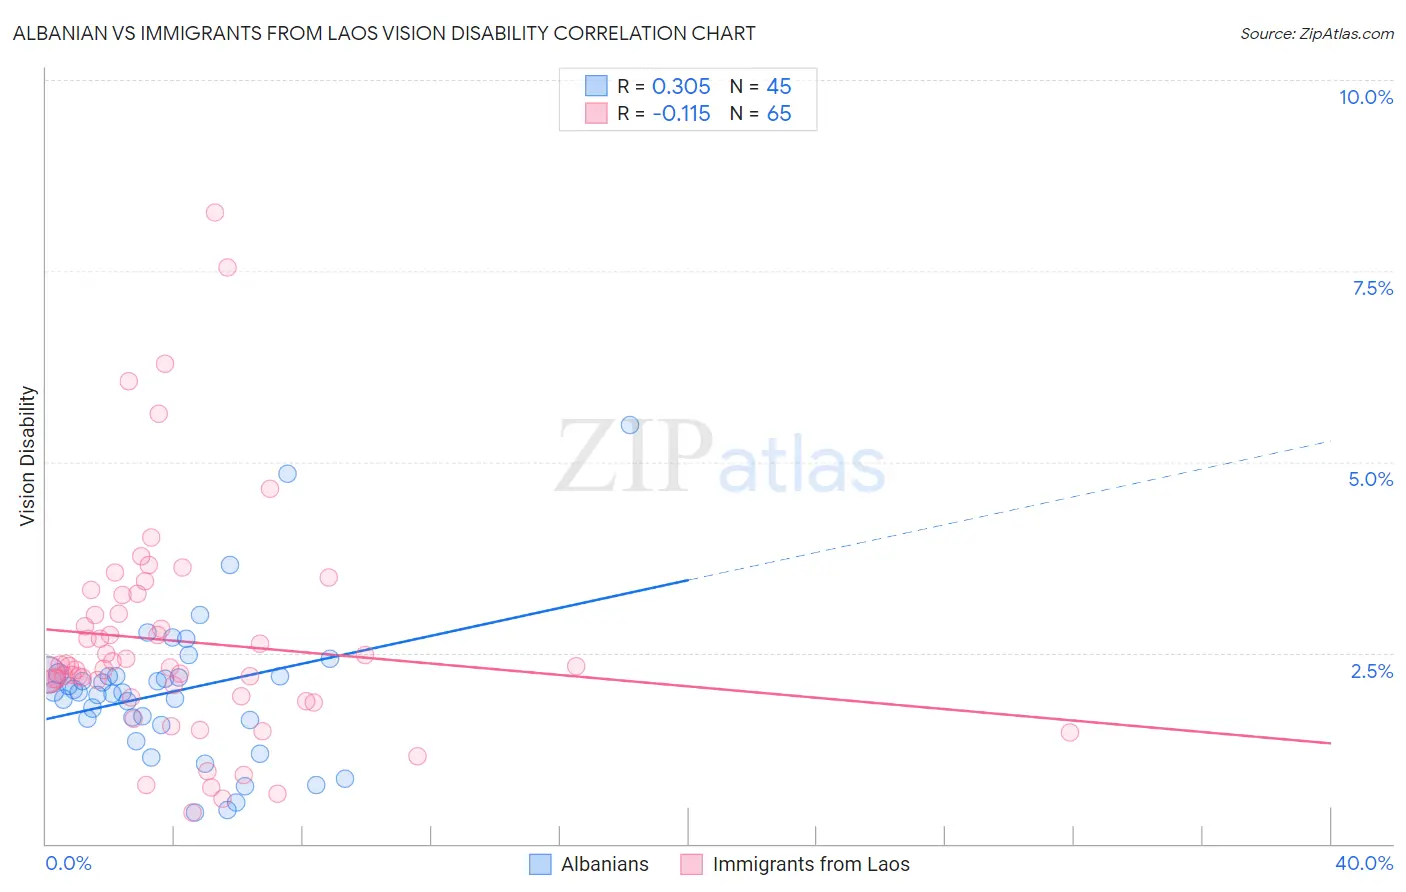
Albanian vs Immigrants from Laos Vision Disability Correlation Chart
The statistical analysis conducted on geographies consisting of 193,200,917 people shows a mild positive correlation between the proportion of Albanians and percentage of population with vision disability in the United States with a correlation coefficient (R) of 0.305 and weighted average of 2.1%. Similarly, the statistical analysis conducted on geographies consisting of 201,435,761 people shows a poor negative correlation between the proportion of Immigrants from Laos and percentage of population with vision disability in the United States with a correlation coefficient (R) of -0.115 and weighted average of 2.4%, a difference of 13.8%.
Vision Disability Correlation Summary
| Measurement | Albanian | Immigrants from Laos |
| Minimum | 0.41% | 0.41% |
| Maximum | 5.5% | 8.3% |
| Range | 5.1% | 7.8% |
| Mean | 2.0% | 2.7% |
| Median | 2.0% | 2.3% |
| Interquartile 25% (IQ1) | 1.6% | 1.9% |
| Interquartile 75% (IQ3) | 2.2% | 3.1% |
| Interquartile Range (IQR) | 0.61% | 1.2% |
| Standard Deviation (Sample) | 0.97% | 1.5% |
| Standard Deviation (Population) | 0.96% | 1.5% |
Similar Demographics by Vision Disability
Demographics Similar to Albanians by Vision Disability
In terms of vision disability, the demographic groups most similar to Albanians are Sri Lankan (2.1%, a difference of 0.030%), Greek (2.1%, a difference of 0.080%), Estonian (2.1%, a difference of 0.12%), Immigrants from Austria (2.1%, a difference of 0.17%), and Immigrants from Italy (2.1%, a difference of 0.17%).
| Demographics | Rating | Rank | Vision Disability |
| Immigrants | Croatia | 96.0 /100 | #94 | Exceptional 2.1% |
| Australians | 95.9 /100 | #95 | Exceptional 2.1% |
| Romanians | 95.7 /100 | #96 | Exceptional 2.1% |
| Immigrants | Afghanistan | 95.6 /100 | #97 | Exceptional 2.1% |
| Immigrants | South Africa | 95.4 /100 | #98 | Exceptional 2.1% |
| Estonians | 95.3 /100 | #99 | Exceptional 2.1% |
| Greeks | 95.1 /100 | #100 | Exceptional 2.1% |
| Albanians | 94.9 /100 | #101 | Exceptional 2.1% |
| Sri Lankans | 94.8 /100 | #102 | Exceptional 2.1% |
| Immigrants | Austria | 94.4 /100 | #103 | Exceptional 2.1% |
| Immigrants | Italy | 94.4 /100 | #104 | Exceptional 2.1% |
| Carpatho Rusyns | 94.3 /100 | #105 | Exceptional 2.1% |
| Swedes | 94.2 /100 | #106 | Exceptional 2.1% |
| Danes | 94.2 /100 | #107 | Exceptional 2.1% |
| Koreans | 94.1 /100 | #108 | Exceptional 2.1% |
Demographics Similar to Immigrants from Laos by Vision Disability
In terms of vision disability, the demographic groups most similar to Immigrants from Laos are Bangladeshi (2.3%, a difference of 0.11%), Liberian (2.3%, a difference of 0.19%), Subsaharan African (2.3%, a difference of 0.21%), Guatemalan (2.3%, a difference of 0.23%), and French (2.3%, a difference of 0.27%).
| Demographics | Rating | Rank | Vision Disability |
| Immigrants | West Indies | 0.6 /100 | #244 | Tragic 2.3% |
| Alsatians | 0.6 /100 | #245 | Tragic 2.3% |
| French | 0.5 /100 | #246 | Tragic 2.3% |
| Guatemalans | 0.5 /100 | #247 | Tragic 2.3% |
| Sub-Saharan Africans | 0.5 /100 | #248 | Tragic 2.3% |
| Liberians | 0.5 /100 | #249 | Tragic 2.3% |
| Bangladeshis | 0.5 /100 | #250 | Tragic 2.3% |
| Immigrants | Laos | 0.4 /100 | #251 | Tragic 2.4% |
| Immigrants | Micronesia | 0.3 /100 | #252 | Tragic 2.4% |
| Japanese | 0.3 /100 | #253 | Tragic 2.4% |
| Haitians | 0.3 /100 | #254 | Tragic 2.4% |
| Immigrants | Guatemala | 0.3 /100 | #255 | Tragic 2.4% |
| Immigrants | Haiti | 0.2 /100 | #256 | Tragic 2.4% |
| West Indians | 0.2 /100 | #257 | Tragic 2.4% |
| British West Indians | 0.2 /100 | #258 | Tragic 2.4% |