Albanian vs Brazilian Vision Disability
COMPARE
Albanian
Brazilian
Vision Disability
Vision Disability Comparison
Albanians
Brazilians
2.1%
VISION DISABILITY
94.9/ 100
METRIC RATING
101st/ 347
METRIC RANK
2.1%
VISION DISABILITY
62.2/ 100
METRIC RATING
168th/ 347
METRIC RANK
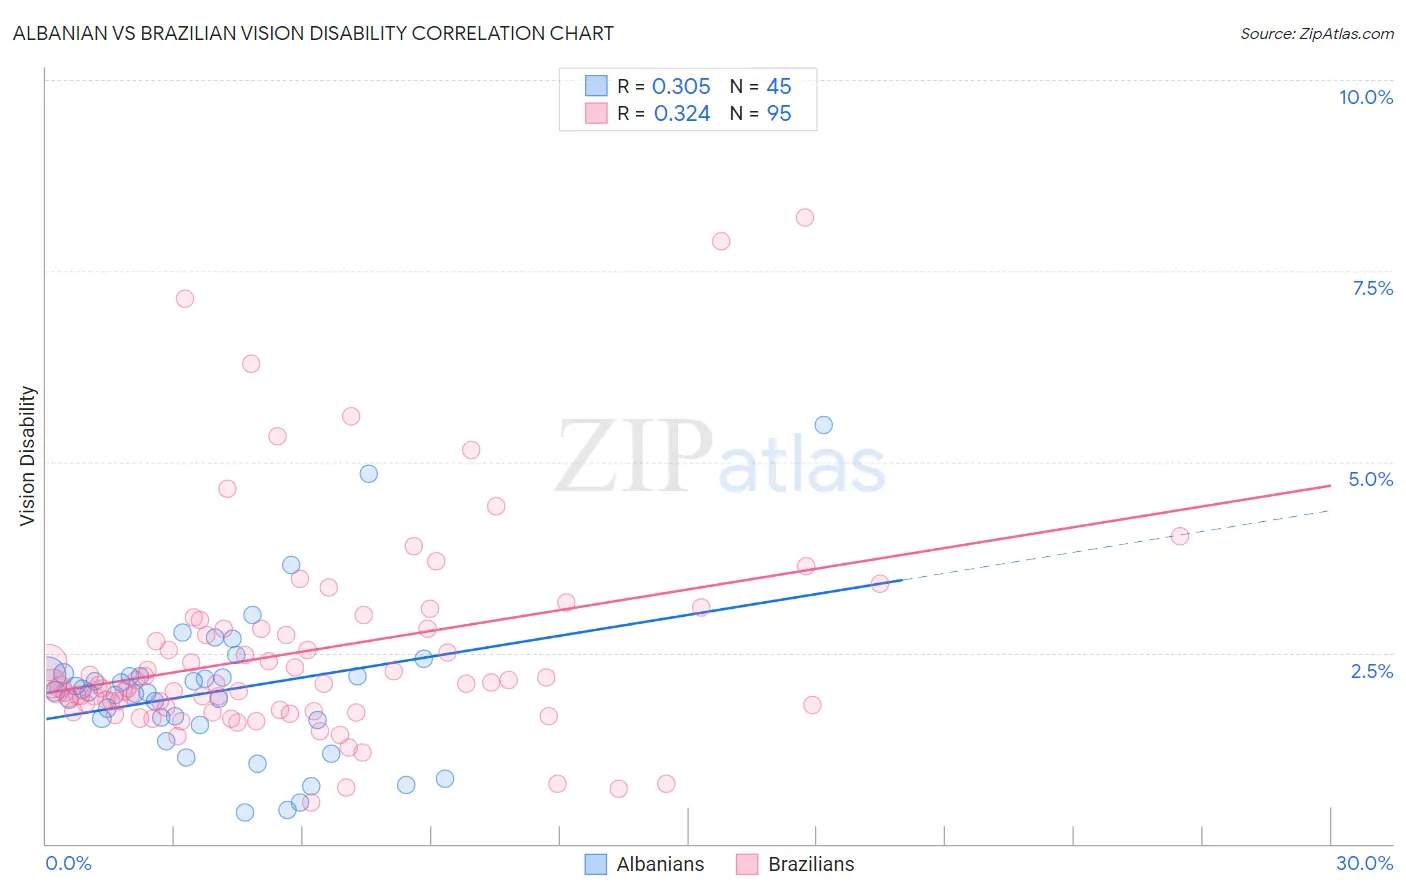
Albanian vs Brazilian Vision Disability Correlation Chart
The statistical analysis conducted on geographies consisting of 193,200,917 people shows a mild positive correlation between the proportion of Albanians and percentage of population with vision disability in the United States with a correlation coefficient (R) of 0.305 and weighted average of 2.1%. Similarly, the statistical analysis conducted on geographies consisting of 323,719,841 people shows a mild positive correlation between the proportion of Brazilians and percentage of population with vision disability in the United States with a correlation coefficient (R) of 0.324 and weighted average of 2.1%, a difference of 4.0%.
Vision Disability Correlation Summary
| Measurement | Albanian | Brazilian |
| Minimum | 0.41% | 0.54% |
| Maximum | 5.5% | 8.2% |
| Range | 5.1% | 7.7% |
| Mean | 2.0% | 2.5% |
| Median | 2.0% | 2.1% |
| Interquartile 25% (IQ1) | 1.6% | 1.7% |
| Interquartile 75% (IQ3) | 2.2% | 2.8% |
| Interquartile Range (IQR) | 0.61% | 1.1% |
| Standard Deviation (Sample) | 0.97% | 1.4% |
| Standard Deviation (Population) | 0.96% | 1.4% |
Similar Demographics by Vision Disability
Demographics Similar to Albanians by Vision Disability
In terms of vision disability, the demographic groups most similar to Albanians are Sri Lankan (2.1%, a difference of 0.030%), Greek (2.1%, a difference of 0.080%), Estonian (2.1%, a difference of 0.12%), Immigrants from Austria (2.1%, a difference of 0.17%), and Immigrants from Italy (2.1%, a difference of 0.17%).
| Demographics | Rating | Rank | Vision Disability |
| Immigrants | Croatia | 96.0 /100 | #94 | Exceptional 2.1% |
| Australians | 95.9 /100 | #95 | Exceptional 2.1% |
| Romanians | 95.7 /100 | #96 | Exceptional 2.1% |
| Immigrants | Afghanistan | 95.6 /100 | #97 | Exceptional 2.1% |
| Immigrants | South Africa | 95.4 /100 | #98 | Exceptional 2.1% |
| Estonians | 95.3 /100 | #99 | Exceptional 2.1% |
| Greeks | 95.1 /100 | #100 | Exceptional 2.1% |
| Albanians | 94.9 /100 | #101 | Exceptional 2.1% |
| Sri Lankans | 94.8 /100 | #102 | Exceptional 2.1% |
| Immigrants | Austria | 94.4 /100 | #103 | Exceptional 2.1% |
| Immigrants | Italy | 94.4 /100 | #104 | Exceptional 2.1% |
| Carpatho Rusyns | 94.3 /100 | #105 | Exceptional 2.1% |
| Swedes | 94.2 /100 | #106 | Exceptional 2.1% |
| Danes | 94.2 /100 | #107 | Exceptional 2.1% |
| Koreans | 94.1 /100 | #108 | Exceptional 2.1% |
Demographics Similar to Brazilians by Vision Disability
In terms of vision disability, the demographic groups most similar to Brazilians are Immigrants from Africa (2.1%, a difference of 0.030%), Immigrants from England (2.1%, a difference of 0.040%), Immigrants from Iraq (2.1%, a difference of 0.18%), Immigrants from Bangladesh (2.1%, a difference of 0.23%), and Icelander (2.1%, a difference of 0.27%).
| Demographics | Rating | Rank | Vision Disability |
| Iraqis | 67.7 /100 | #161 | Good 2.1% |
| Hungarians | 67.4 /100 | #162 | Good 2.1% |
| Icelanders | 66.1 /100 | #163 | Good 2.1% |
| Immigrants | Bangladesh | 65.5 /100 | #164 | Good 2.1% |
| Immigrants | Iraq | 64.8 /100 | #165 | Good 2.1% |
| Immigrants | England | 62.8 /100 | #166 | Good 2.1% |
| Immigrants | Africa | 62.6 /100 | #167 | Good 2.1% |
| Brazilians | 62.2 /100 | #168 | Good 2.1% |
| South American Indians | 57.4 /100 | #169 | Average 2.2% |
| Swiss | 55.7 /100 | #170 | Average 2.2% |
| Lebanese | 54.3 /100 | #171 | Average 2.2% |
| Northern Europeans | 50.1 /100 | #172 | Average 2.2% |
| Scandinavians | 50.0 /100 | #173 | Average 2.2% |
| Immigrants | Canada | 50.0 /100 | #174 | Average 2.2% |
| Immigrants | Fiji | 47.6 /100 | #175 | Average 2.2% |