Albanian vs Immigrants from Egypt Vision Disability
COMPARE
Albanian
Immigrants from Egypt
Vision Disability
Vision Disability Comparison
Albanians
Immigrants from Egypt
2.1%
VISION DISABILITY
94.9/ 100
METRIC RATING
101st/ 347
METRIC RANK
1.9%
VISION DISABILITY
99.9/ 100
METRIC RATING
33rd/ 347
METRIC RANK
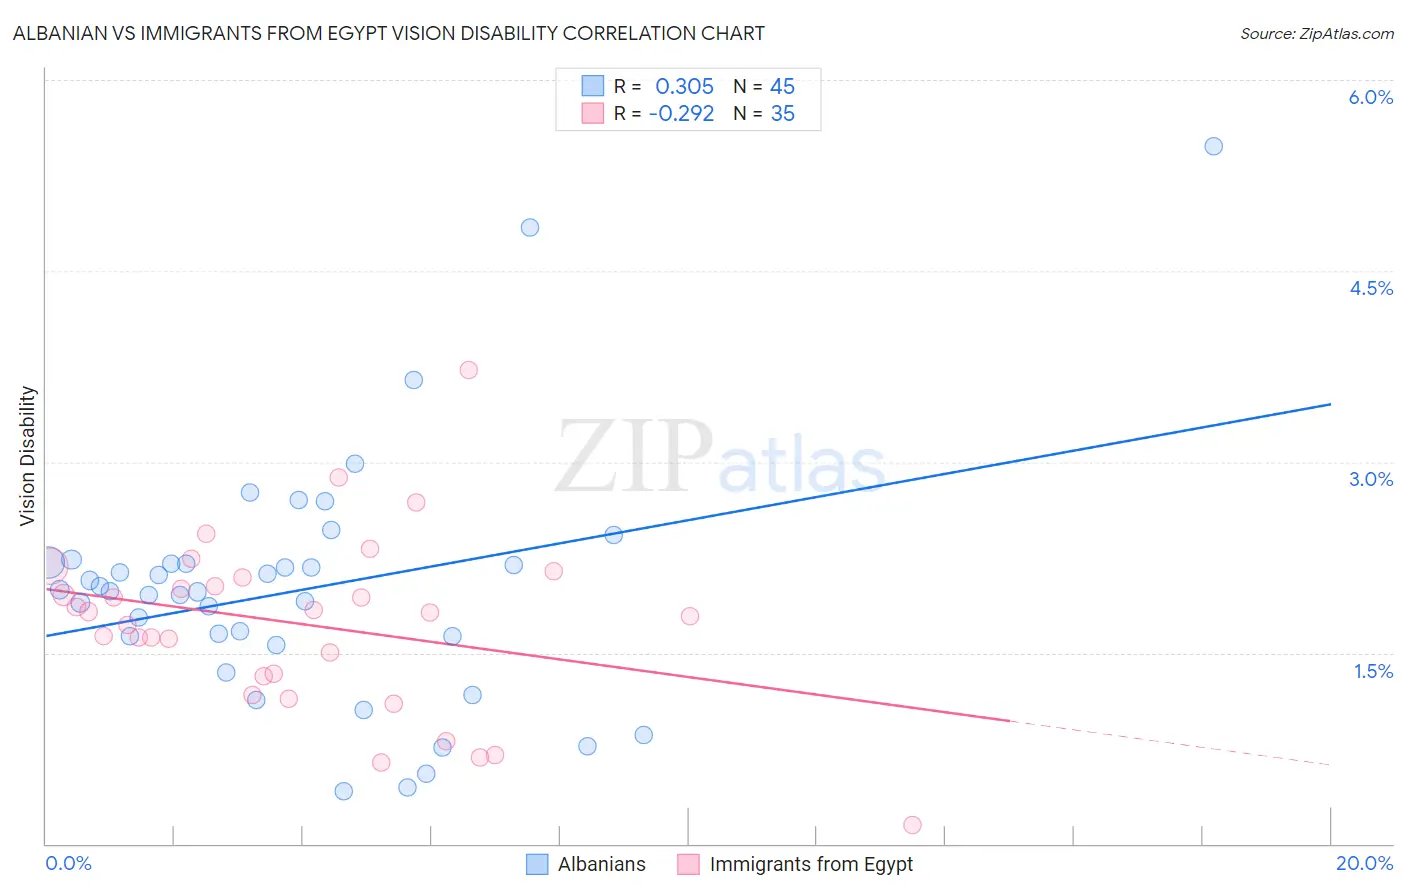
Albanian vs Immigrants from Egypt Vision Disability Correlation Chart
The statistical analysis conducted on geographies consisting of 193,200,917 people shows a mild positive correlation between the proportion of Albanians and percentage of population with vision disability in the United States with a correlation coefficient (R) of 0.305 and weighted average of 2.1%. Similarly, the statistical analysis conducted on geographies consisting of 245,409,407 people shows a weak negative correlation between the proportion of Immigrants from Egypt and percentage of population with vision disability in the United States with a correlation coefficient (R) of -0.292 and weighted average of 1.9%, a difference of 6.3%.
Vision Disability Correlation Summary
| Measurement | Albanian | Immigrants from Egypt |
| Minimum | 0.41% | 0.14% |
| Maximum | 5.5% | 3.7% |
| Range | 5.1% | 3.6% |
| Mean | 2.0% | 1.7% |
| Median | 2.0% | 1.8% |
| Interquartile 25% (IQ1) | 1.6% | 1.3% |
| Interquartile 75% (IQ3) | 2.2% | 2.1% |
| Interquartile Range (IQR) | 0.61% | 0.78% |
| Standard Deviation (Sample) | 0.97% | 0.69% |
| Standard Deviation (Population) | 0.96% | 0.68% |
Similar Demographics by Vision Disability
Demographics Similar to Albanians by Vision Disability
In terms of vision disability, the demographic groups most similar to Albanians are Sri Lankan (2.1%, a difference of 0.030%), Greek (2.1%, a difference of 0.080%), Estonian (2.1%, a difference of 0.12%), Immigrants from Austria (2.1%, a difference of 0.17%), and Immigrants from Italy (2.1%, a difference of 0.17%).
| Demographics | Rating | Rank | Vision Disability |
| Immigrants | Croatia | 96.0 /100 | #94 | Exceptional 2.1% |
| Australians | 95.9 /100 | #95 | Exceptional 2.1% |
| Romanians | 95.7 /100 | #96 | Exceptional 2.1% |
| Immigrants | Afghanistan | 95.6 /100 | #97 | Exceptional 2.1% |
| Immigrants | South Africa | 95.4 /100 | #98 | Exceptional 2.1% |
| Estonians | 95.3 /100 | #99 | Exceptional 2.1% |
| Greeks | 95.1 /100 | #100 | Exceptional 2.1% |
| Albanians | 94.9 /100 | #101 | Exceptional 2.1% |
| Sri Lankans | 94.8 /100 | #102 | Exceptional 2.1% |
| Immigrants | Austria | 94.4 /100 | #103 | Exceptional 2.1% |
| Immigrants | Italy | 94.4 /100 | #104 | Exceptional 2.1% |
| Carpatho Rusyns | 94.3 /100 | #105 | Exceptional 2.1% |
| Swedes | 94.2 /100 | #106 | Exceptional 2.1% |
| Danes | 94.2 /100 | #107 | Exceptional 2.1% |
| Koreans | 94.1 /100 | #108 | Exceptional 2.1% |
Demographics Similar to Immigrants from Egypt by Vision Disability
In terms of vision disability, the demographic groups most similar to Immigrants from Egypt are Immigrants from Turkey (1.9%, a difference of 0.13%), Immigrants from Australia (1.9%, a difference of 0.22%), Luxembourger (1.9%, a difference of 0.31%), Cambodian (2.0%, a difference of 0.57%), and Mongolian (1.9%, a difference of 0.58%).
| Demographics | Rating | Rank | Vision Disability |
| Immigrants | Japan | 99.9 /100 | #26 | Exceptional 1.9% |
| Taiwanese | 99.9 /100 | #27 | Exceptional 1.9% |
| Immigrants | Malaysia | 99.9 /100 | #28 | Exceptional 1.9% |
| Egyptians | 99.9 /100 | #29 | Exceptional 1.9% |
| Immigrants | Nepal | 99.9 /100 | #30 | Exceptional 1.9% |
| Mongolians | 99.9 /100 | #31 | Exceptional 1.9% |
| Luxembourgers | 99.9 /100 | #32 | Exceptional 1.9% |
| Immigrants | Egypt | 99.9 /100 | #33 | Exceptional 1.9% |
| Immigrants | Turkey | 99.8 /100 | #34 | Exceptional 1.9% |
| Immigrants | Australia | 99.8 /100 | #35 | Exceptional 1.9% |
| Cambodians | 99.8 /100 | #36 | Exceptional 2.0% |
| Bhutanese | 99.8 /100 | #37 | Exceptional 2.0% |
| Immigrants | Kuwait | 99.8 /100 | #38 | Exceptional 2.0% |
| Zimbabweans | 99.7 /100 | #39 | Exceptional 2.0% |
| Immigrants | Ireland | 99.7 /100 | #40 | Exceptional 2.0% |