Immigrants from Czechoslovakia vs Immigrants from Serbia Hearing Disability
COMPARE
Immigrants from Czechoslovakia
Immigrants from Serbia
Hearing Disability
Hearing Disability Comparison
Immigrants from Czechoslovakia
Immigrants from Serbia
3.1%
HEARING DISABILITY
15.9/ 100
METRIC RATING
204th/ 347
METRIC RANK
3.0%
HEARING DISABILITY
51.1/ 100
METRIC RATING
173rd/ 347
METRIC RANK
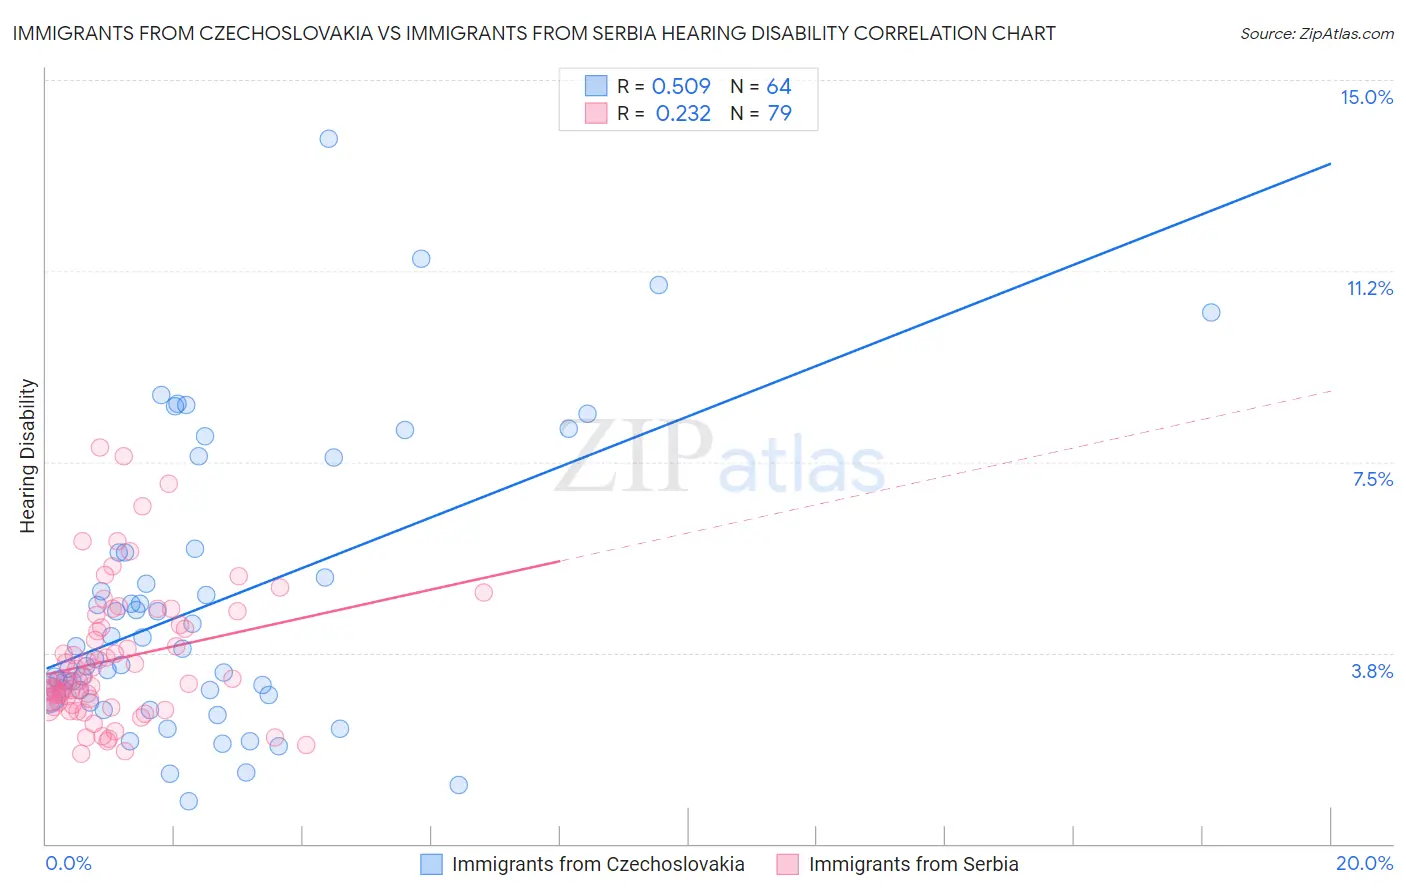
Immigrants from Czechoslovakia vs Immigrants from Serbia Hearing Disability Correlation Chart
The statistical analysis conducted on geographies consisting of 195,448,522 people shows a substantial positive correlation between the proportion of Immigrants from Czechoslovakia and percentage of population with hearing disability in the United States with a correlation coefficient (R) of 0.509 and weighted average of 3.1%. Similarly, the statistical analysis conducted on geographies consisting of 131,744,668 people shows a weak positive correlation between the proportion of Immigrants from Serbia and percentage of population with hearing disability in the United States with a correlation coefficient (R) of 0.232 and weighted average of 3.0%, a difference of 4.0%.
Hearing Disability Correlation Summary
| Measurement | Immigrants from Czechoslovakia | Immigrants from Serbia |
| Minimum | 0.83% | 1.8% |
| Maximum | 13.9% | 7.8% |
| Range | 13.0% | 6.0% |
| Mean | 4.7% | 3.6% |
| Median | 3.7% | 3.2% |
| Interquartile 25% (IQ1) | 2.9% | 2.7% |
| Interquartile 75% (IQ3) | 5.7% | 4.3% |
| Interquartile Range (IQR) | 2.8% | 1.6% |
| Standard Deviation (Sample) | 2.8% | 1.3% |
| Standard Deviation (Population) | 2.8% | 1.3% |
Similar Demographics by Hearing Disability
Demographics Similar to Immigrants from Czechoslovakia by Hearing Disability
In terms of hearing disability, the demographic groups most similar to Immigrants from Czechoslovakia are Alsatian (3.1%, a difference of 0.0%), Immigrants from Denmark (3.1%, a difference of 0.050%), Eastern European (3.1%, a difference of 0.070%), Immigrants from Thailand (3.1%, a difference of 0.090%), and Hispanic or Latino (3.1%, a difference of 0.13%).
| Demographics | Rating | Rank | Hearing Disability |
| Immigrants | Bosnia and Herzegovina | 20.6 /100 | #197 | Fair 3.1% |
| Immigrants | Croatia | 20.5 /100 | #198 | Fair 3.1% |
| Syrians | 19.2 /100 | #199 | Poor 3.1% |
| Immigrants | North Macedonia | 19.1 /100 | #200 | Poor 3.1% |
| Iraqis | 19.0 /100 | #201 | Poor 3.1% |
| Immigrants | Thailand | 16.4 /100 | #202 | Poor 3.1% |
| Immigrants | Denmark | 16.2 /100 | #203 | Poor 3.1% |
| Immigrants | Czechoslovakia | 15.9 /100 | #204 | Poor 3.1% |
| Alsatians | 15.9 /100 | #205 | Poor 3.1% |
| Eastern Europeans | 15.5 /100 | #206 | Poor 3.1% |
| Hispanics or Latinos | 15.1 /100 | #207 | Poor 3.1% |
| Immigrants | Latvia | 12.7 /100 | #208 | Poor 3.1% |
| Immigrants | Hungary | 12.5 /100 | #209 | Poor 3.1% |
| Cape Verdeans | 12.2 /100 | #210 | Poor 3.1% |
| Romanians | 12.1 /100 | #211 | Poor 3.1% |
Demographics Similar to Immigrants from Serbia by Hearing Disability
In terms of hearing disability, the demographic groups most similar to Immigrants from Serbia are Indonesian (3.0%, a difference of 0.10%), Immigrants from Romania (3.0%, a difference of 0.25%), Panamanian (3.0%, a difference of 0.38%), Immigrants from Philippines (3.0%, a difference of 0.44%), and Armenian (3.0%, a difference of 0.47%).
| Demographics | Rating | Rank | Hearing Disability |
| Immigrants | South Eastern Asia | 62.9 /100 | #166 | Good 3.0% |
| Immigrants | Eastern Europe | 58.1 /100 | #167 | Average 3.0% |
| Immigrants | Greece | 57.9 /100 | #168 | Average 3.0% |
| Arabs | 57.6 /100 | #169 | Average 3.0% |
| Immigrants | Cabo Verde | 56.9 /100 | #170 | Average 3.0% |
| Immigrants | Ukraine | 56.6 /100 | #171 | Average 3.0% |
| Armenians | 56.0 /100 | #172 | Average 3.0% |
| Immigrants | Serbia | 51.1 /100 | #173 | Average 3.0% |
| Indonesians | 50.0 /100 | #174 | Average 3.0% |
| Immigrants | Romania | 48.4 /100 | #175 | Average 3.0% |
| Panamanians | 47.0 /100 | #176 | Average 3.0% |
| Immigrants | Philippines | 46.4 /100 | #177 | Average 3.0% |
| Japanese | 46.0 /100 | #178 | Average 3.0% |
| Immigrants | Moldova | 43.1 /100 | #179 | Average 3.0% |
| Immigrants | Sweden | 42.4 /100 | #180 | Average 3.0% |