Alaskan Athabascan vs Immigrants from Cambodia Disability Age 65 to 74
COMPARE
Alaskan Athabascan
Immigrants from Cambodia
Disability Age 65 to 74
Disability Age 65 to 74 Comparison
Alaskan Athabascans
Immigrants from Cambodia
32.4%
DISABILITY AGE 65 TO 74
0.0/ 100
METRIC RATING
338th/ 347
METRIC RANK
25.3%
DISABILITY AGE 65 TO 74
0.3/ 100
METRIC RATING
259th/ 347
METRIC RANK
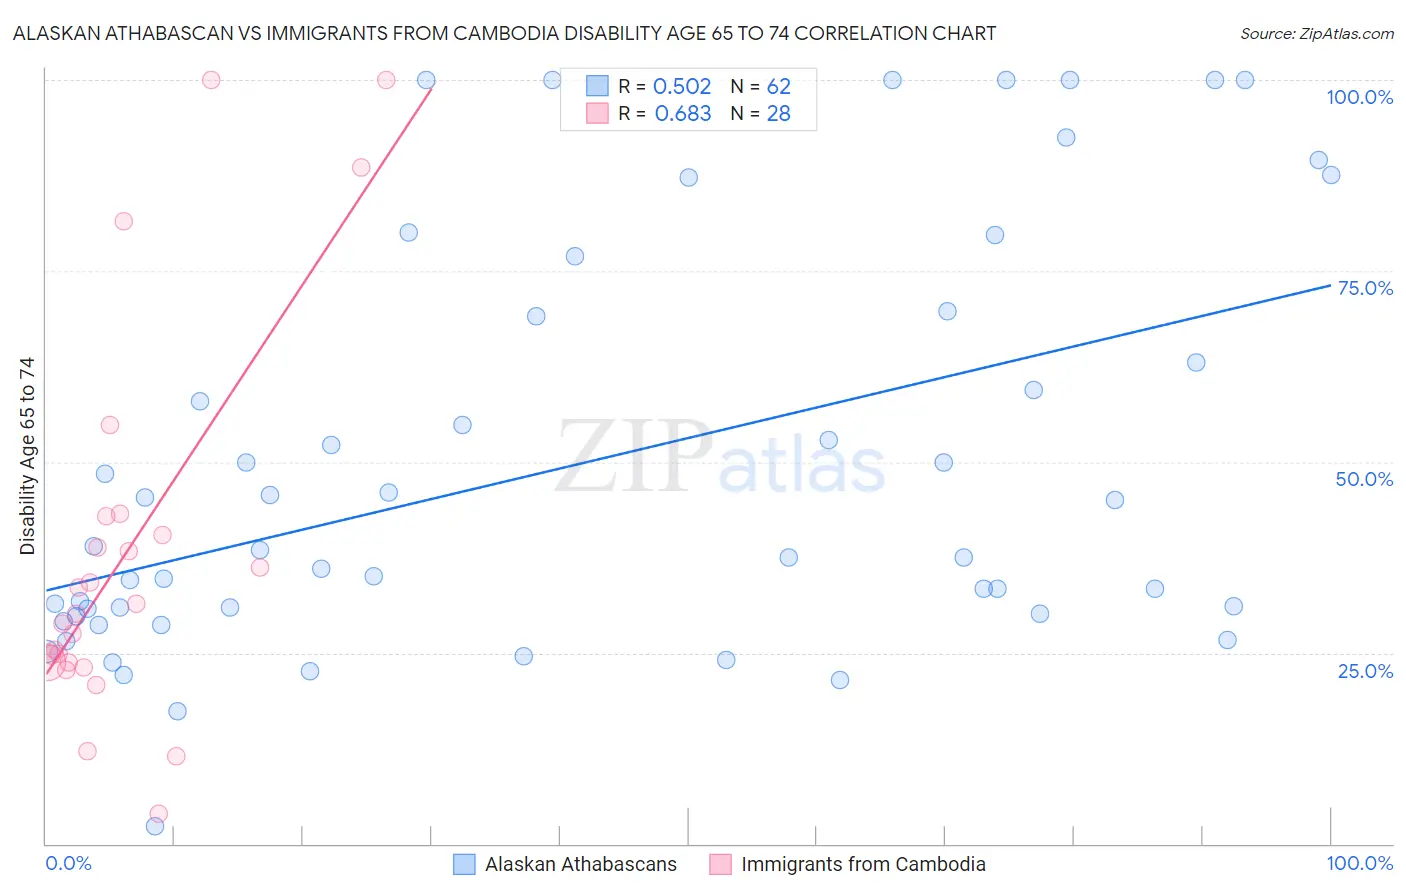
Alaskan Athabascan vs Immigrants from Cambodia Disability Age 65 to 74 Correlation Chart
The statistical analysis conducted on geographies consisting of 45,797,821 people shows a substantial positive correlation between the proportion of Alaskan Athabascans and percentage of population with a disability between the ages 65 and 75 in the United States with a correlation coefficient (R) of 0.502 and weighted average of 32.4%. Similarly, the statistical analysis conducted on geographies consisting of 205,056,933 people shows a significant positive correlation between the proportion of Immigrants from Cambodia and percentage of population with a disability between the ages 65 and 75 in the United States with a correlation coefficient (R) of 0.683 and weighted average of 25.3%, a difference of 27.8%.
Disability Age 65 to 74 Correlation Summary
| Measurement | Alaskan Athabascan | Immigrants from Cambodia |
| Minimum | 2.3% | 4.0% |
| Maximum | 100.0% | 100.0% |
| Range | 97.7% | 96.0% |
| Mean | 49.4% | 38.1% |
| Median | 38.0% | 30.8% |
| Interquartile 25% (IQ1) | 30.1% | 23.8% |
| Interquartile 75% (IQ3) | 69.1% | 41.6% |
| Interquartile Range (IQR) | 39.0% | 17.9% |
| Standard Deviation (Sample) | 26.6% | 25.1% |
| Standard Deviation (Population) | 26.4% | 24.6% |
Similar Demographics by Disability Age 65 to 74
Demographics Similar to Alaskan Athabascans by Disability Age 65 to 74
In terms of disability age 65 to 74, the demographic groups most similar to Alaskan Athabascans are Houma (32.3%, a difference of 0.19%), Kiowa (32.6%, a difference of 0.62%), Lumbee (32.7%, a difference of 1.1%), Tsimshian (32.9%, a difference of 1.7%), and Pueblo (33.1%, a difference of 2.3%).
| Demographics | Rating | Rank | Disability Age 65 to 74 |
| Chickasaw | 0.0 /100 | #331 | Tragic 30.2% |
| Natives/Alaskans | 0.0 /100 | #332 | Tragic 30.4% |
| Colville | 0.0 /100 | #333 | Tragic 30.5% |
| Alaska Natives | 0.0 /100 | #334 | Tragic 30.6% |
| Cheyenne | 0.0 /100 | #335 | Tragic 31.1% |
| Yuman | 0.0 /100 | #336 | Tragic 31.5% |
| Houma | 0.0 /100 | #337 | Tragic 32.3% |
| Alaskan Athabascans | 0.0 /100 | #338 | Tragic 32.4% |
| Kiowa | 0.0 /100 | #339 | Tragic 32.6% |
| Lumbee | 0.0 /100 | #340 | Tragic 32.7% |
| Tsimshian | 0.0 /100 | #341 | Tragic 32.9% |
| Pueblo | 0.0 /100 | #342 | Tragic 33.1% |
| Navajo | 0.0 /100 | #343 | Tragic 33.3% |
| Inupiat | 0.0 /100 | #344 | Tragic 34.5% |
| Tohono O'odham | 0.0 /100 | #345 | Tragic 36.0% |
Demographics Similar to Immigrants from Cambodia by Disability Age 65 to 74
In terms of disability age 65 to 74, the demographic groups most similar to Immigrants from Cambodia are Marshallese (25.3%, a difference of 0.090%), Guamanian/Chamorro (25.3%, a difference of 0.15%), Immigrants from Somalia (25.2%, a difference of 0.32%), Malaysian (25.4%, a difference of 0.32%), and Cape Verdean (25.4%, a difference of 0.40%).
| Demographics | Rating | Rank | Disability Age 65 to 74 |
| Immigrants | El Salvador | 0.6 /100 | #252 | Tragic 25.1% |
| Sub-Saharan Africans | 0.6 /100 | #253 | Tragic 25.1% |
| Somalis | 0.6 /100 | #254 | Tragic 25.1% |
| Central Americans | 0.5 /100 | #255 | Tragic 25.1% |
| Immigrants | Somalia | 0.4 /100 | #256 | Tragic 25.2% |
| Guamanians/Chamorros | 0.3 /100 | #257 | Tragic 25.3% |
| Marshallese | 0.3 /100 | #258 | Tragic 25.3% |
| Immigrants | Cambodia | 0.3 /100 | #259 | Tragic 25.3% |
| Malaysians | 0.2 /100 | #260 | Tragic 25.4% |
| Cape Verdeans | 0.2 /100 | #261 | Tragic 25.4% |
| Samoans | 0.2 /100 | #262 | Tragic 25.4% |
| Iroquois | 0.2 /100 | #263 | Tragic 25.4% |
| Hawaiians | 0.2 /100 | #264 | Tragic 25.5% |
| Guatemalans | 0.2 /100 | #265 | Tragic 25.5% |
| Immigrants | Latin America | 0.1 /100 | #266 | Tragic 25.6% |