Alaskan Athabascan vs Immigrants from Cuba Disability Age 65 to 74

COMPARE

Alaskan Athabascan
Race
Ancestry
AfghanAfricanAlaska NativeAlaskan AthabascanAlbanianAleutAlsatianAmericanApacheArabArapahoArgentineanArmenianAssyrian/Chaldean/SyriacAustralianAustrianBahamianBangladeshiBarbadianBasqueBelgianBelizeanBermudanBhutaneseBlackfeetBolivianBrazilianBritishBritish West IndianBulgarianBurmeseCajunCambodianCanadianCape VerdeanCarpatho RusynCelticCentral AmericanCentral American IndianCherokeeCheyenneChickasawChileanChineseChippewaChoctawColombianColvilleComancheCosta RicanCreeCreekCroatianCrowCubanCypriotCzechCzechoslovakianDanishDelawareDominicanDutchDutch West IndianEastern EuropeanEcuadorianEgyptianEnglishEstonianEthiopianEuropeanFijianFilipinoFinnishFrenchFrench American IndianFrench CanadianGermanGerman RussianGhanaianGreekGuamanian/ChamorroGuatemalanGuyaneseHaitianHmongHonduranHopiHoumaHungarianIcelanderIndian (Asian)IndonesianInupiatIranianIraqiIrishIroquoisIsraeliItalianJamaicanJapaneseJordanianKenyanKiowaKoreanLaotianLatvianLebaneseLiberianLithuanianLumbeeLuxembourgerMacedonianMalaysianMalteseMarshalleseMenomineeMexicanMexican American IndianMongolianMoroccanNative HawaiianNavajoNepaleseNew ZealanderNicaraguanNigerianNorthern EuropeanNorwegianOkinawanOsageOttawaPaiutePakistaniPalestinianPanamanianParaguayanPennsylvania GermanPeruvianPimaPolishPortuguesePotawatomiPuebloPuerto RicanPuget Sound SalishRomanianRussianSalvadoranSamoanScandinavianScotch-IrishScottishSeminoleSenegaleseSerbianShoshoneSierra LeoneanSiouxSlavicSlovakSloveneSomaliSouth AfricanSouth AmericanSouth American IndianSoviet UnionSpaniardSpanishSpanish AmericanSpanish American IndianSri LankanSubsaharan AfricanSudaneseSwedishSwissSyrianTaiwaneseThaiTlingit-HaidaTohono O'OdhamTonganTrinidadian and TobagonianTsimshianTurkishU.S. Virgin IslanderUgandanUkrainianUruguayanUteVenezuelanVietnameseWelshWest IndianYakamaYaquiYugoslavianYumanYup'ikZimbabwean
Immigration
NonimmigrantsImmigrantsAfghanistanAfricaAlbaniaArgentinaArmeniaAsiaAustraliaAustriaBahamasBangladeshBarbadosBelarusBelgiumBelizeBoliviaBosnia and HerzegovinaBrazilBulgariaBurma/MyanmarCabo VerdeCambodiaCameroonCanadaCaribbeanCentral AmericaChileChinaColombiaCongoCosta RicaCroatiaCzechoslovakiaDenmarkDominicaDominican RepublicEastern AfricaEastern AsiaEastern EuropeEcuadorEgyptEl SalvadorEnglandEritreaEthiopiaEuropeFijiFranceGermanyGhanaGreeceGrenadaGuatemalaGuyanaHaitiHondurasHong KongHungaryIndiaIndonesiaIranIraqIrelandIsraelItalyJamaicaJapanJordanKazakhstanKenyaKoreaKuwaitLaosLatin AmericaLatviaLebanonLiberiaLithuaniaMalaysiaMexicoMicronesiaMiddle AfricaMoldovaMoroccoNepalNetherlandsNicaraguaNigeriaNorth AmericaNorth MacedoniaNorthern AfricaNorthern EuropeNorwayOceaniaPakistanPanamaPeruPhilippinesPolandPortugalRomaniaRussiaSaudi ArabiaScotlandSenegalSerbiaSierra LeoneSingaporeSomaliaSouth AfricaSouth AmericaSouth Central AsiaSouth Eastern AsiaSouthern EuropeSpainSri LankaSt. Vincent and the GrenadinesSudanSwedenSwitzerlandSyriaTaiwanThailandTrinidad and TobagoTurkeyUgandaUkraineUruguayUzbekistanVenezuelaVietnamWest IndiesWestern AfricaWestern AsiaWestern EuropeYemenZaireZimbabweAzores
Immigrants from Cuba
Race
Ancestry
AfghanAfricanAlaska NativeAlbanianAleutAlsatianAmericanApacheArabArapahoArgentineanArmenianAssyrian/Chaldean/SyriacAustralianAustrianBahamianBangladeshiBarbadianBasqueBelgianBelizeanBermudanBhutaneseBlackfeetBolivianBrazilianBritishBritish West IndianBulgarianBurmeseCajunCambodianCanadianCape VerdeanCarpatho RusynCelticCentral AmericanCentral American IndianCherokeeCheyenneChickasawChileanChineseChippewaChoctawColombianColvilleComancheCosta RicanCreeCreekCroatianCrowCubanCypriotCzechCzechoslovakianDanishDelawareDominicanDutchDutch West IndianEastern EuropeanEcuadorianEgyptianEnglishEstonianEthiopianEuropeanFijianFilipinoFinnishFrenchFrench American IndianFrench CanadianGermanGerman RussianGhanaianGreekGuamanian/ChamorroGuatemalanGuyaneseHaitianHmongHonduranHopiHoumaHungarianIcelanderIndian (Asian)IndonesianInupiatIranianIraqiIrishIroquoisIsraeliItalianJamaicanJapaneseJordanianKenyanKiowaKoreanLaotianLatvianLebaneseLiberianLithuanianLumbeeLuxembourgerMacedonianMalaysianMalteseMarshalleseMenomineeMexicanMexican American IndianMongolianMoroccanNative HawaiianNavajoNepaleseNew ZealanderNicaraguanNigerianNorthern EuropeanNorwegianOkinawanOsageOttawaPaiutePakistaniPalestinianPanamanianParaguayanPennsylvania GermanPeruvianPimaPolishPortuguesePotawatomiPuebloPuerto RicanPuget Sound SalishRomanianRussianSalvadoranSamoanScandinavianScotch-IrishScottishSeminoleSenegaleseSerbianShoshoneSierra LeoneanSiouxSlavicSlovakSloveneSomaliSouth AfricanSouth AmericanSouth American IndianSoviet UnionSpaniardSpanishSpanish AmericanSpanish American IndianSri LankanSubsaharan AfricanSudaneseSwedishSwissSyrianTaiwaneseThaiTlingit-HaidaTohono O'OdhamTonganTrinidadian and TobagonianTsimshianTurkishU.S. Virgin IslanderUgandanUkrainianUruguayanUteVenezuelanVietnameseWelshWest IndianYakamaYaquiYugoslavianYumanYup'ikZimbabwean
Immigration
NonimmigrantsImmigrantsAfghanistanAfricaAlbaniaArgentinaArmeniaAsiaAustraliaAustriaBahamasBangladeshBarbadosBelarusBelgiumBelizeBoliviaBosnia and HerzegovinaBrazilBulgariaBurma/MyanmarCabo VerdeCambodiaCameroonCanadaCaribbeanCentral AmericaChileChinaColombiaCongoCosta RicaCroatiaCubaCzechoslovakiaDenmarkDominicaDominican RepublicEastern AfricaEastern AsiaEastern EuropeEcuadorEgyptEl SalvadorEnglandEritreaEthiopiaEuropeFijiFranceGermanyGhanaGreeceGrenadaGuatemalaGuyanaHaitiHondurasHong KongHungaryIndiaIndonesiaIranIraqIrelandIsraelItalyJamaicaJapanJordanKazakhstanKenyaKoreaKuwaitLaosLatin AmericaLatviaLebanonLiberiaLithuaniaMalaysiaMexicoMicronesiaMiddle AfricaMoldovaMoroccoNepalNetherlandsNicaraguaNigeriaNorth AmericaNorth MacedoniaNorthern AfricaNorthern EuropeNorwayOceaniaPakistanPanamaPeruPhilippinesPolandPortugalRomaniaRussiaSaudi ArabiaScotlandSenegalSerbiaSierra LeoneSingaporeSomaliaSouth AfricaSouth AmericaSouth Central AsiaSouth Eastern AsiaSouthern EuropeSpainSri LankaSt. Vincent and the GrenadinesSudanSwedenSwitzerlandSyriaTaiwanThailandTrinidad and TobagoTurkeyUgandaUkraineUruguayUzbekistanVenezuelaVietnamWest IndiesWestern AfricaWestern AsiaWestern EuropeYemenZaireZimbabweAzores
Disability Age 65 to 74
Income
Poverty
Unemployment
Labor Participation
Family Structure
Vehicle Availability
Education Level
Disability

Disability Age 65 to 74 Comparison

Alaskan Athabascans

Immigrants from Cuba

Tragic
Fair
32.4%
DISABILITY AGE 65 TO 74
0.0/ 100
METRIC RATING
338th/ 347
METRIC RANK
23.6%
DISABILITY AGE 65 TO 74
34.0/ 100
METRIC RATING
188th/ 347
METRIC RANK

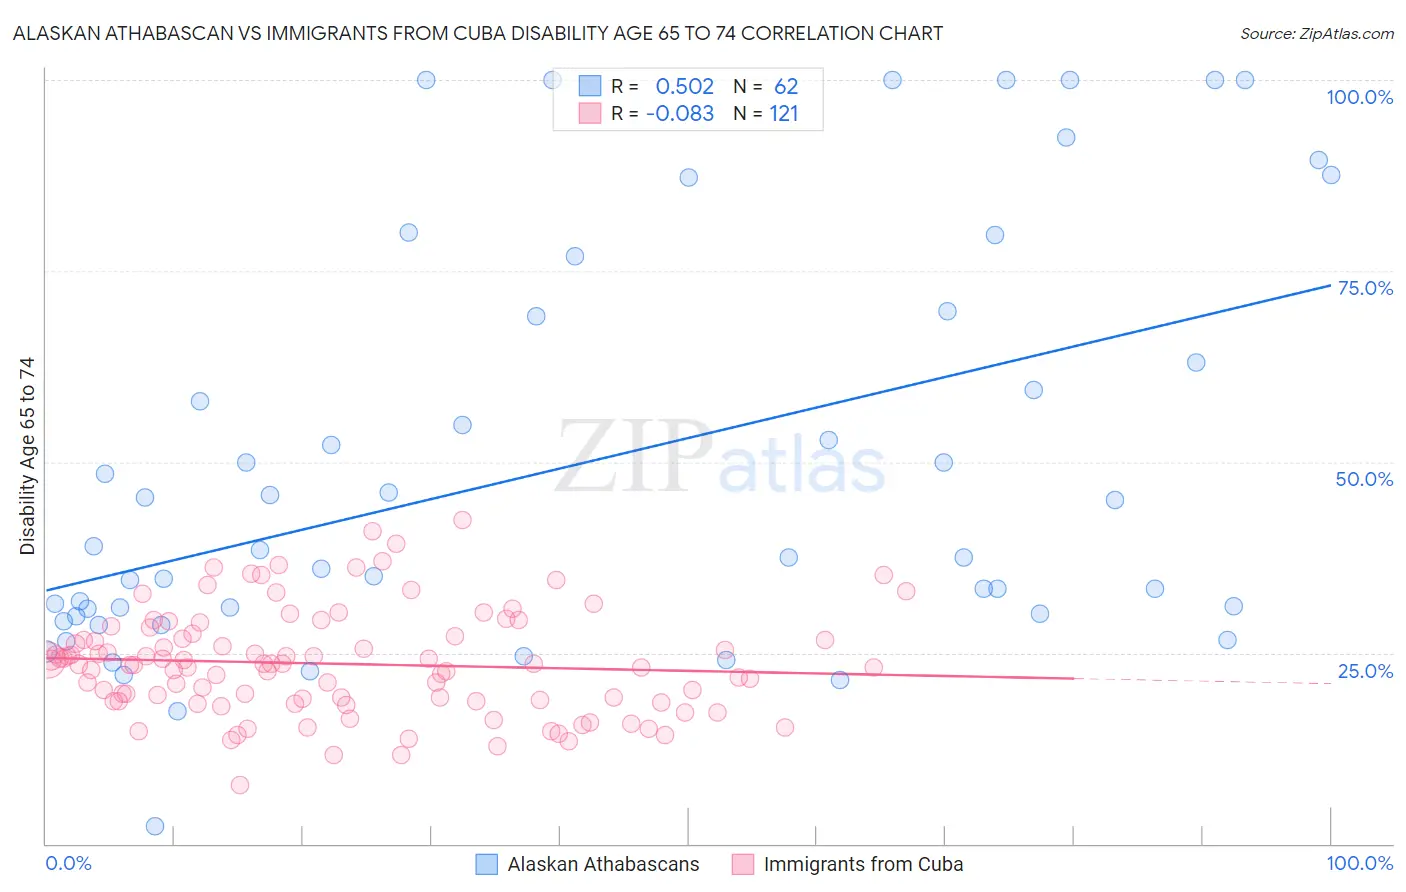
Alaskan Athabascan vs Immigrants from Cuba Disability Age 65 to 74 Correlation Chart

The statistical analysis conducted on geographies consisting of 45,797,821 people shows a substantial positive correlation between the proportion of Alaskan Athabascans and percentage of population with a disability between the ages 65 and 75 in the United States with a correlation coefficient (R) of 0.502 and weighted average of 32.4%. Similarly, the statistical analysis conducted on geographies consisting of 325,637,866 people shows a slight negative correlation between the proportion of Immigrants from Cuba and percentage of population with a disability between the ages 65 and 75 in the United States with a correlation coefficient (R) of -0.083 and weighted average of 23.6%, a difference of 37.3%.
Alaskan Athabascan vs Immigrants from Cuba Disability Age 65 to 74

Disability Age 65 to 74 Correlation Summary

MeasurementAlaskan AthabascanImmigrants from Cuba
Minimum2.3%7.7%
Maximum100.0%42.5%
Range97.7%34.8%
Mean49.4%23.6%
Median38.0%23.5%
Interquartile 25% (IQ1)30.1%18.6%
Interquartile 75% (IQ3)69.1%27.4%
Interquartile Range (IQR)39.0%8.8%
Standard Deviation (Sample)26.6%6.8%
Standard Deviation (Population)26.4%6.8%

Similar Demographics by Disability Age 65 to 74

Demographics Similar to Alaskan Athabascans by Disability Age 65 to 74

In terms of disability age 65 to 74, the demographic groups most similar to Alaskan Athabascans are Houma (32.3%, a difference of 0.19%), Kiowa (32.6%, a difference of 0.62%), Lumbee (32.7%, a difference of 1.1%), Tsimshian (32.9%, a difference of 1.7%), and Pueblo (33.1%, a difference of 2.3%).
DemographicsRating | RankDisability Age 65 to 74
Chickasaw
0.0
/100
|
#331
Tragic
30.2%
Natives/Alaskans
0.0
/100
|
#332
Tragic
30.4%
Colville
0.0
/100
|
#333
Tragic
30.5%
Alaska Natives
0.0
/100
|
#334
Tragic
30.6%
Cheyenne
0.0
/100
|
#335
Tragic
31.1%
Yuman
0.0
/100
|
#336
Tragic
31.5%
Houma
0.0
/100
|
#337
Tragic
32.3%
Alaskan Athabascans
0.0
/100
|
#338
Tragic
32.4%
Kiowa
0.0
/100
|
#339
Tragic
32.6%
Lumbee
0.0
/100
|
#340
Tragic
32.7%
Tsimshian
0.0
/100
|
#341
Tragic
32.9%
Pueblo
0.0
/100
|
#342
Tragic
33.1%
Navajo
0.0
/100
|
#343
Tragic
33.3%
Inupiat
0.0
/100
|
#344
Tragic
34.5%
Tohono O'odham
0.0
/100
|
#345
Tragic
36.0%

Demographics Similar to Immigrants from Cuba by Disability Age 65 to 74

In terms of disability age 65 to 74, the demographic groups most similar to Immigrants from Cuba are Scottish (23.6%, a difference of 0.060%), Immigrants from Guyana (23.6%, a difference of 0.18%), Portuguese (23.5%, a difference of 0.24%), Immigrants from Bangladesh (23.6%, a difference of 0.25%), and Basque (23.5%, a difference of 0.27%).
DemographicsRating | RankDisability Age 65 to 74
Assyrians/Chaldeans/Syriacs
45.3
/100
|
#181
Average
23.4%
Irish
44.4
/100
|
#182
Average
23.4%
Immigrants | Eastern Africa
42.8
/100
|
#183
Average
23.4%
Immigrants | Germany
42.5
/100
|
#184
Average
23.4%
Haitians
42.4
/100
|
#185
Average
23.4%
Basques
38.4
/100
|
#186
Fair
23.5%
Portuguese
37.8
/100
|
#187
Fair
23.5%
Immigrants | Cuba
34.0
/100
|
#188
Fair
23.6%
Scottish
33.1
/100
|
#189
Fair
23.6%
Immigrants | Guyana
31.2
/100
|
#190
Fair
23.6%
Immigrants | Bangladesh
30.2
/100
|
#191
Fair
23.6%
Ecuadorians
29.7
/100
|
#192
Fair
23.6%
English
28.5
/100
|
#193
Fair
23.6%
Sudanese
27.8
/100
|
#194
Fair
23.7%
Immigrants | St. Vincent and the Grenadines
26.1
/100
|
#195
Fair
23.7%