Blackfeet vs Immigrants from Cambodia Disability Age 65 to 74
COMPARE
Blackfeet
Immigrants from Cambodia
Disability Age 65 to 74
Disability Age 65 to 74 Comparison
Blackfeet
Immigrants from Cambodia
26.6%
DISABILITY AGE 65 TO 74
0.0/ 100
METRIC RATING
292nd/ 347
METRIC RANK
25.3%
DISABILITY AGE 65 TO 74
0.3/ 100
METRIC RATING
259th/ 347
METRIC RANK
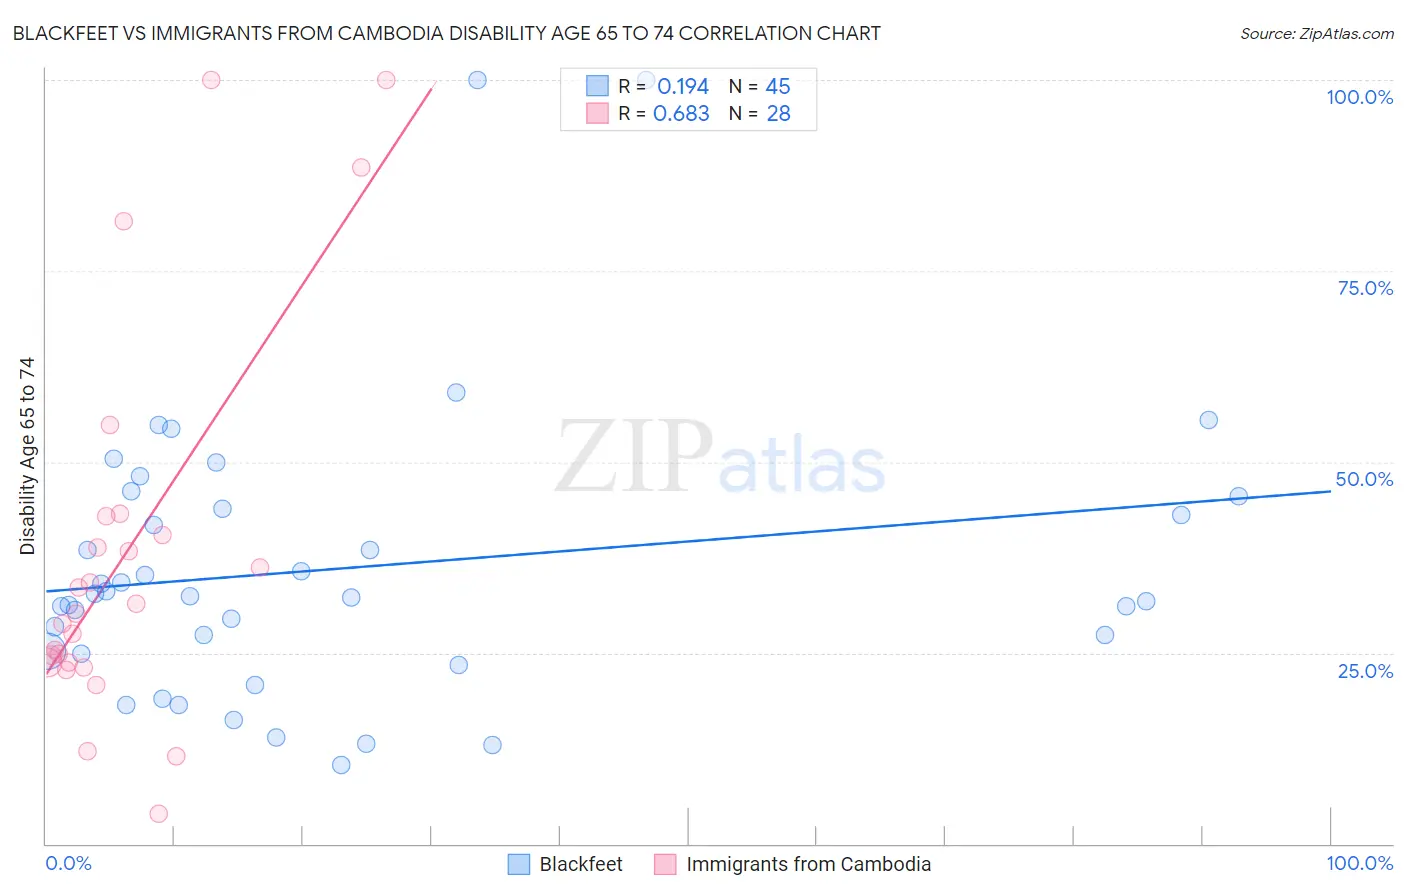
Blackfeet vs Immigrants from Cambodia Disability Age 65 to 74 Correlation Chart
The statistical analysis conducted on geographies consisting of 309,087,362 people shows a poor positive correlation between the proportion of Blackfeet and percentage of population with a disability between the ages 65 and 75 in the United States with a correlation coefficient (R) of 0.194 and weighted average of 26.6%. Similarly, the statistical analysis conducted on geographies consisting of 205,056,933 people shows a significant positive correlation between the proportion of Immigrants from Cambodia and percentage of population with a disability between the ages 65 and 75 in the United States with a correlation coefficient (R) of 0.683 and weighted average of 25.3%, a difference of 5.1%.
Disability Age 65 to 74 Correlation Summary
| Measurement | Blackfeet | Immigrants from Cambodia |
| Minimum | 10.2% | 4.0% |
| Maximum | 100.0% | 100.0% |
| Range | 89.8% | 96.0% |
| Mean | 36.1% | 38.1% |
| Median | 32.3% | 30.8% |
| Interquartile 25% (IQ1) | 25.1% | 23.8% |
| Interquartile 75% (IQ3) | 44.6% | 41.6% |
| Interquartile Range (IQR) | 19.6% | 17.9% |
| Standard Deviation (Sample) | 18.6% | 25.1% |
| Standard Deviation (Population) | 18.4% | 24.6% |
Similar Demographics by Disability Age 65 to 74
Demographics Similar to Blackfeet by Disability Age 65 to 74
In terms of disability age 65 to 74, the demographic groups most similar to Blackfeet are Immigrants from Central America (26.6%, a difference of 0.16%), Dominican (26.7%, a difference of 0.28%), Hispanic or Latino (26.7%, a difference of 0.30%), Spanish American Indian (26.4%, a difference of 0.88%), and Bangladeshi (26.8%, a difference of 0.91%).
| Demographics | Rating | Rank | Disability Age 65 to 74 |
| Immigrants | Congo | 0.0 /100 | #285 | Tragic 26.0% |
| Immigrants | Micronesia | 0.0 /100 | #286 | Tragic 26.1% |
| Immigrants | Laos | 0.0 /100 | #287 | Tragic 26.1% |
| Mexican American Indians | 0.0 /100 | #288 | Tragic 26.2% |
| Africans | 0.0 /100 | #289 | Tragic 26.2% |
| Immigrants | Cabo Verde | 0.0 /100 | #290 | Tragic 26.3% |
| Spanish American Indians | 0.0 /100 | #291 | Tragic 26.4% |
| Blackfeet | 0.0 /100 | #292 | Tragic 26.6% |
| Immigrants | Central America | 0.0 /100 | #293 | Tragic 26.6% |
| Dominicans | 0.0 /100 | #294 | Tragic 26.7% |
| Hispanics or Latinos | 0.0 /100 | #295 | Tragic 26.7% |
| Bangladeshis | 0.0 /100 | #296 | Tragic 26.8% |
| Fijians | 0.0 /100 | #297 | Tragic 27.0% |
| Immigrants | Yemen | 0.0 /100 | #298 | Tragic 27.0% |
| Potawatomi | 0.0 /100 | #299 | Tragic 27.0% |
Demographics Similar to Immigrants from Cambodia by Disability Age 65 to 74
In terms of disability age 65 to 74, the demographic groups most similar to Immigrants from Cambodia are Marshallese (25.3%, a difference of 0.090%), Guamanian/Chamorro (25.3%, a difference of 0.15%), Immigrants from Somalia (25.2%, a difference of 0.32%), Malaysian (25.4%, a difference of 0.32%), and Cape Verdean (25.4%, a difference of 0.40%).
| Demographics | Rating | Rank | Disability Age 65 to 74 |
| Immigrants | El Salvador | 0.6 /100 | #252 | Tragic 25.1% |
| Sub-Saharan Africans | 0.6 /100 | #253 | Tragic 25.1% |
| Somalis | 0.6 /100 | #254 | Tragic 25.1% |
| Central Americans | 0.5 /100 | #255 | Tragic 25.1% |
| Immigrants | Somalia | 0.4 /100 | #256 | Tragic 25.2% |
| Guamanians/Chamorros | 0.3 /100 | #257 | Tragic 25.3% |
| Marshallese | 0.3 /100 | #258 | Tragic 25.3% |
| Immigrants | Cambodia | 0.3 /100 | #259 | Tragic 25.3% |
| Malaysians | 0.2 /100 | #260 | Tragic 25.4% |
| Cape Verdeans | 0.2 /100 | #261 | Tragic 25.4% |
| Samoans | 0.2 /100 | #262 | Tragic 25.4% |
| Iroquois | 0.2 /100 | #263 | Tragic 25.4% |
| Hawaiians | 0.2 /100 | #264 | Tragic 25.5% |
| Guatemalans | 0.2 /100 | #265 | Tragic 25.5% |
| Immigrants | Latin America | 0.1 /100 | #266 | Tragic 25.6% |